In this continuing series of posts on Suzieq, we’ll look at 5 questions to which Suzieq can provide answers
In the outputs below, the presence of ‘….’ is an indication that I’ve snipped the output for brevity
Do I have network virtualization in my network?
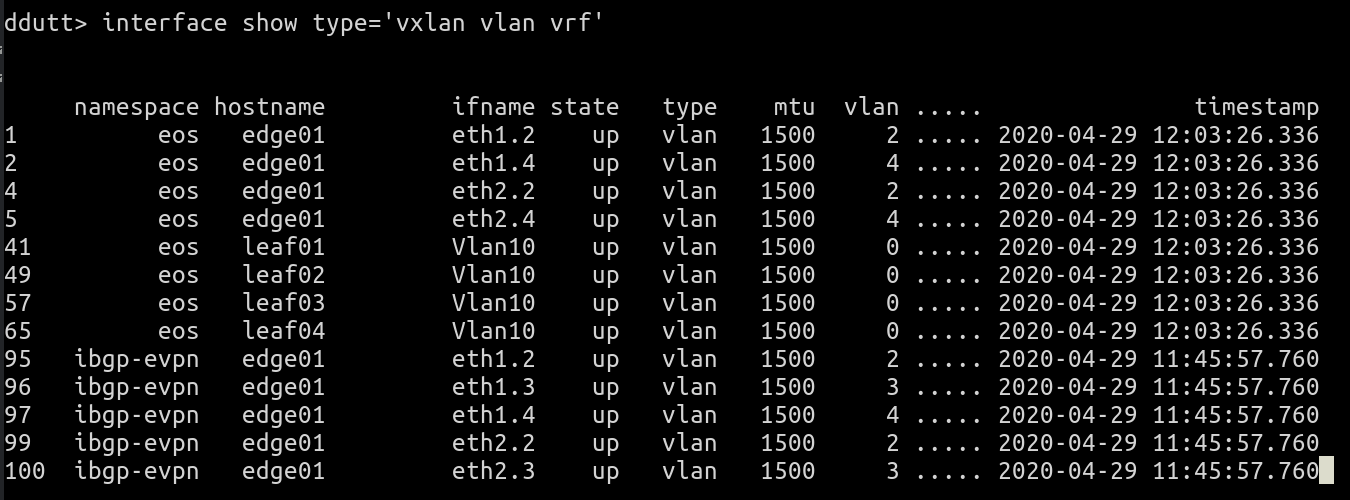
Are you using network virtualization in your network? Network virtualization enables a network operator to carve a single physical network into multiple isolated virtual networks. Network virtualization comes in many different guises. The three most common ways of doing network virtualization in the data center is using VLANs, VRFs and VXLAN. Thus, to check if your network has any network virtualization, you can use interface show with these three types selected.
interface show type='vlan vrf vxlan'
Only the start of the command output is shown for brevity.
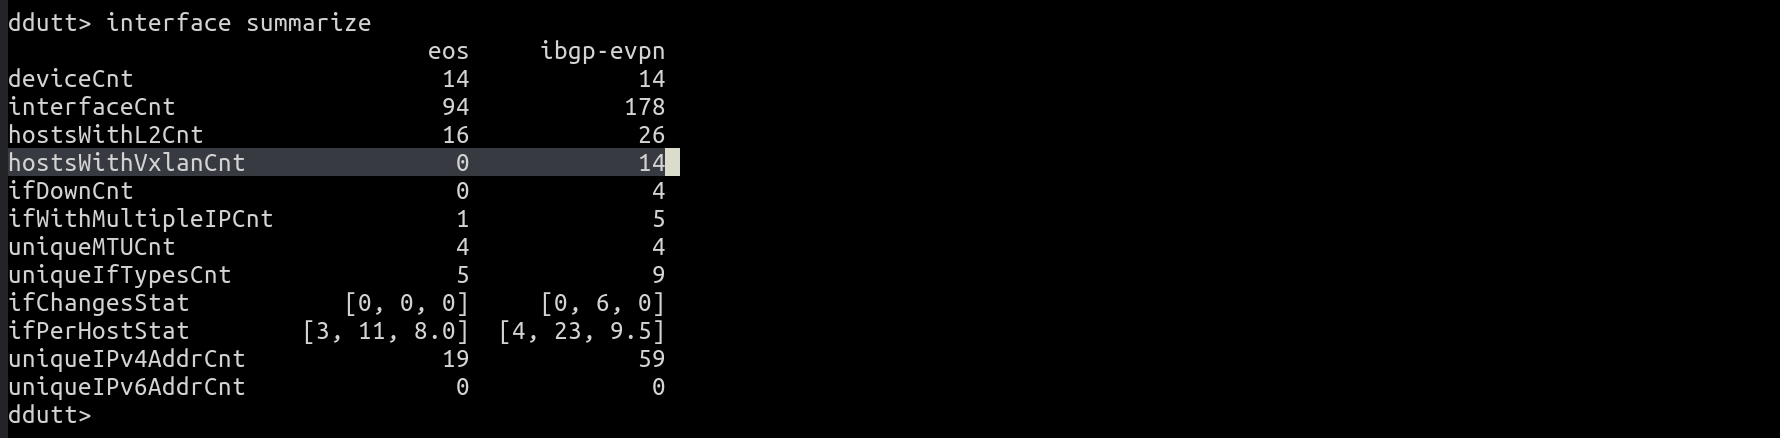
 If you’re instead interested in only knowing if VXLAN is enabled in your network, you can either remove vlan and vrf from the filter for type above, or alternately you could use interface summarize command as follows:
interface summarize
And see that the namespace eos has no VXLAN (hostsWithVxlanCnt is 0) while ibgp-evpn does (hostsWithVxlanCnt is 14).
Which of the interfaces in my network are flapping the most?
With Suzieq, you can easily find out if there are flaky interfaces via the interface summarize command. We showed the output of interface summarize in the previous question. That output shows that the statistic, ifChangesStat, for the namespace ibgp-evpn, has a non-zero max value. In any summarize output, every variable that ends with “Stat” is a list of three values that summarizes a particular metric across all the hosts in that namespace. The three variables are min, max and median values of the metric.
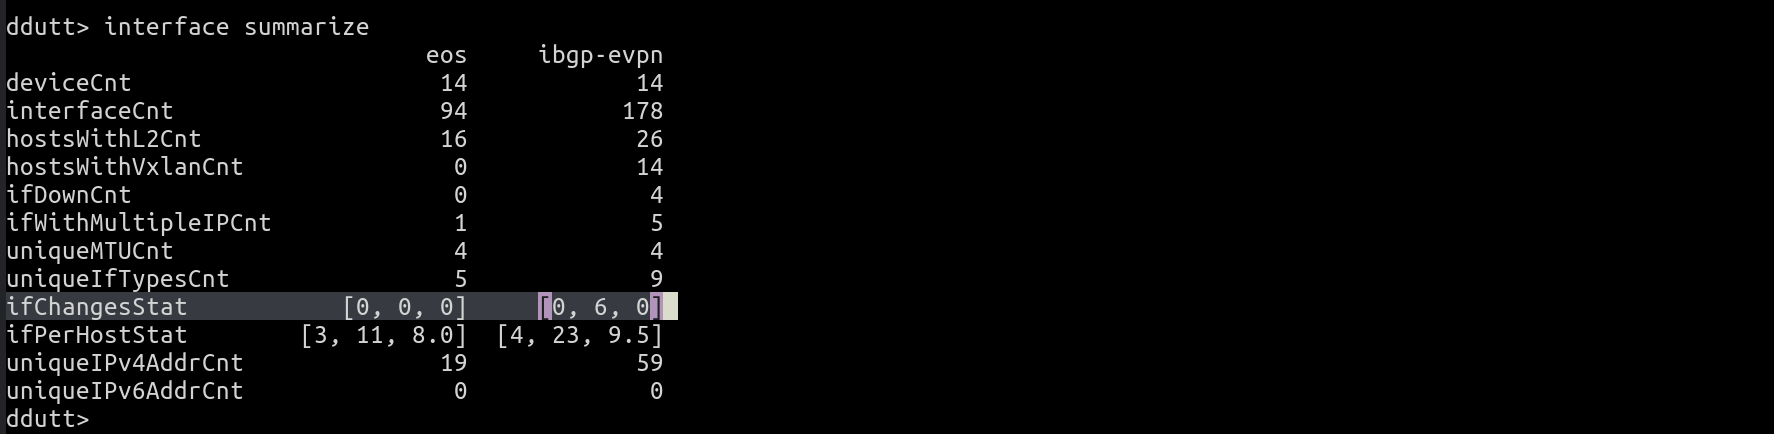 In this case, for the metric ifChangesStat, the output says that for the ibgp-evpn namespace, there are a maximum of 6 interface flaps, while the median indicates that the many interfaces have no changes at all, as it should be. To dig deeper into which interface(s) have this maximum flaps, you can use interface top as follows:
interface top what=flaps namespace=ibgp-evpn
Which produces the following output:
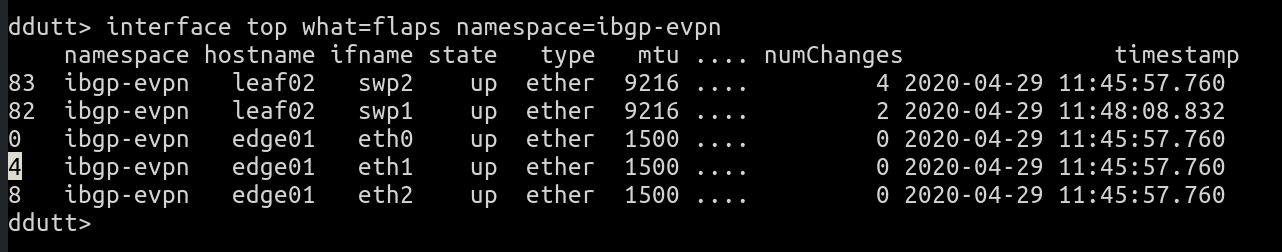 This shows that for some reason interfaces swp2 and swp1 on leaf02 have flapped a bunch of times. The remaining interfaces on the list show 0 changes. So, these two interfaces are the sole cause. To see how many times the interfaces have changed and at what times, you can run
interface show namespace=ibgp-evpn hostname=leaf02 ifname='swp1 swp2' view=all columns='namespace hostname ifname state master numChanges timestamp'
This shows the output as follows:
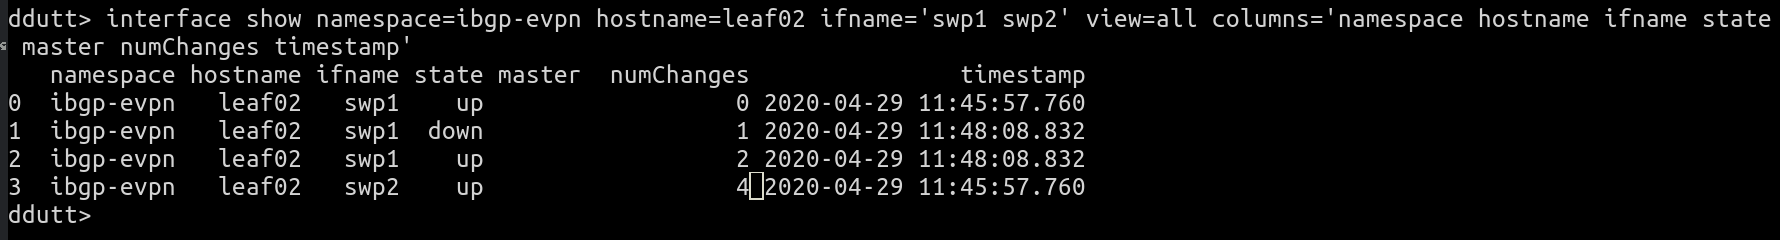 It shows that a single up-down-up transition at 11:48:08 resulted in the flap count going up by 2. We started capturing statistics around 11:45 and right away at that point, swp2 was showing 4 changes. This indicates that whatever the changes, they happened before the data gathering began.
This output indicates that the counting of flaps seems really off. In reality, we found a silly bug here (string concat instead of integer add). There were only 1 or 2 changes, not 11 or 22. Bug will be fixed in the next release in a week or so.
Many of us are unaware of the changes that’s going on in our network. In very large networks, something is always in trouble. The most common way people deal with this is to generate alerts. But generating alerts for every turmoil is the most common cause for alert fatigue. To avoid this fatigue, people raise the alert thresholds. With Suzieq, you can generate daily reports of what changed as a way to deal with changes without using alerts. More on this in a later blog post.
How many different MTUs do I have in my network?
MTUs can be a pain if not configured right. They can be the cause of poor throughput and subtle connectivity failures, if not caught at the level of an MTU problem. So, as a network operator to know what different MTUs exist in your network is important.
Suzieq can help you answer this question in one of two ways. Using interface summarize, you can get a measure of the MTU distribution. In summarize, we show either the different values of a specific field or just the count of the different values, if the different values are greater than three. The main reason for doing this is to have compact outputs. We believe compact outputs helps with better absorption of the information presented.
Coming back to the case of the MTU, we see that there are 4 different values in each of the namespaces. To investigate what the values are, you use the unique verb, as follows:
interface unique columns=mtu namespace=eos
This produces the following output:
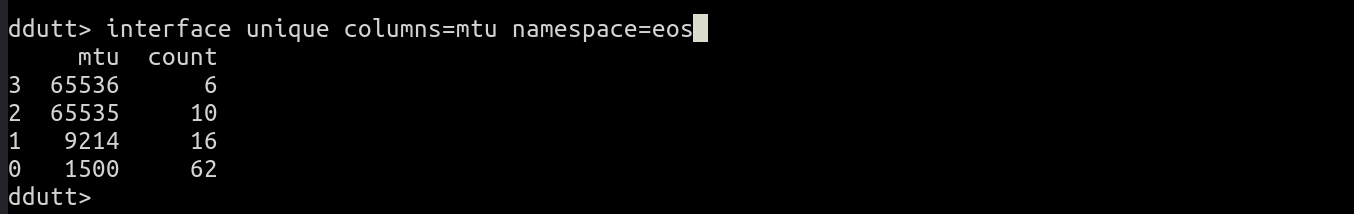 Its interesting to see that there are two MTUs, 65535 and 65536 that are off by 1. 65535 is the maximum number that can be stored as a 16-bit integer. I suspect this is showing you an implementation choice. I looked up SNMP’s Interfaces MIB which defines the type for MTU as a 32-bit integer.
So, which device is defining an MTU as 65535 and which device is defining it as 65536? To track this down, you cannot use just Suzieq because it doesn’t yet support a method for filtering on MTU values. So, we’ll have to rely on grep combined with Suzieq, as shown below:
suzieq-cli interface show --namespace=eos --columns='hostname ifname mtu' | grep 6553
This produces the following output:
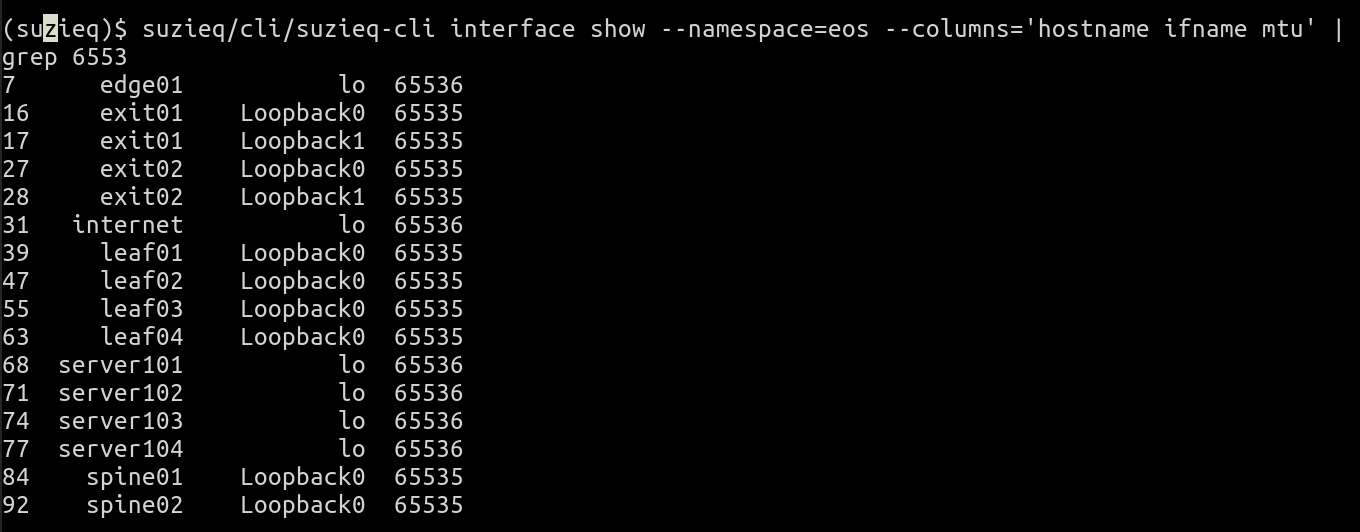 The first thing this tells you is that all the interfaces with those MTU values are loopback interfaces (name is lo or Loopback0). Devices with Loopback0 have an MTU of 65535 and those with lo as the interface name have 65536 as the MTU. So what are these two classes of devices. You can use device show to determine this, but knowing that this is in the namespace eos, I can say that it only contains Linux machines (Cumulus Linux and servers) and Arista routers. Linux uses lo as the loopback name, and so Arista uses 65535 as the loopback MTU.
The trip to look at the interfaces MIB led me to remember what a privilege its been for me to work with so many industry luminaries. Keith McCloghrie who was Mr.SNMP to those who knew of his work, was one such luminary. I was still a kid when I met him and worked closely with him. He was always kind and generous with his time to me. I learnt many things including the art of reading your own writing as if someone else had written it, to catch assumptions and leaps of logic that didn’t add up. Sadly, Keith passed away last year. His obituary was posted in the local newspaper.
There you have in a nutshell, the beauty of observability. A simple question that led you down a path of discovery and remembrance. And there’s so much more Suzieq can do with MTU, but more on that in another post.
How do I know that the poller is gathering data properly?
A classic problem with any observability system is the old Latin phrase, Quis custodiet ipsos custodes. In other words (and in another language), who watches the watchers. How do we know Suzieq is gathering the data properly? Suzieq uses a resource called sqPoller for this task. It is a table that you can query like any other table. You can query the sqPoller table for the dataset we have as follows:
sqpoller show namespace=ibgp-evpn status= fail
which produces the following output:
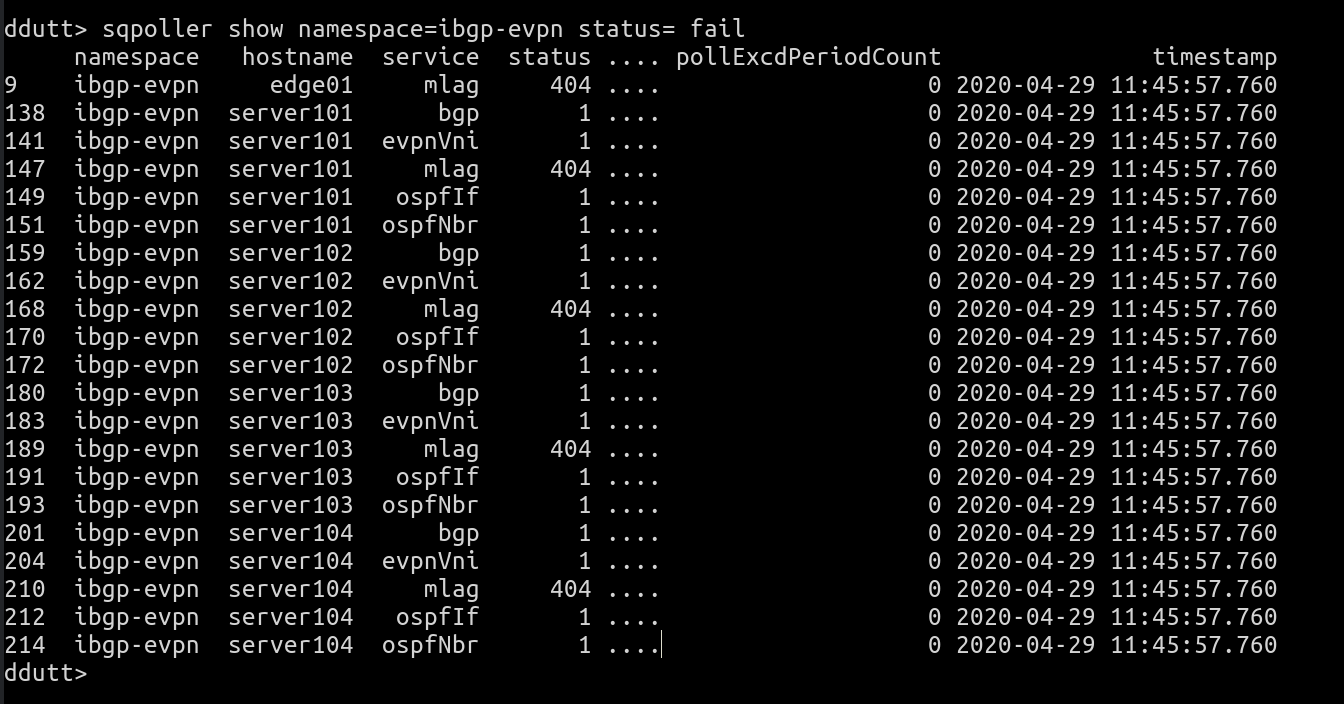 This indicates that the servers are all failing to fetch mlag, ospf, bgp and evpn data. This is to be expected because the endpoints typically don’t run those services. If we cannot communicate with any device, we flag the error with a specific status code, 408 (the HTTP status code for Request Timeout).
Another important statistic to pay attention to is the pollExcdPeriodCount field. This indicates the number of times in a 5-minute interval that the time to fetch data from the remote node exceeded the poll interval.
The sq-poller dumps this data whenever it encounters an error on a node for the first time, or every 5 minutes. If the error recovers, and then happens again, its logged again the first time it happens, before falling back to every 5 minutes as before.
Which Device Has the Longest Uptime? Smallest Uptime?
A final question we pose in this post is to check which device has the longest uptime in the network at this point. You can do this using the top option associated with the device table, as follows:
device top what=uptime namespace=eos count=1
This produces the output:
 If you want to see the device with the smallest uptime, you add the reverse option, as follows:
device top what=uptime namespace=eos count=1 reverse=True
which produces the output:
 It is possible to see more than one entry by changing the value of count. By default, you can see the top five or bottom five entries.
Before we end this post, an answer to a trivia question. A reader wrote that the original CCR song whose song by the same name is what this software is named after had a capital Q i.e. it was spelled SuzieQ, not Suzieq. He’s right. However, we didn’t say that this program was the exact copy of that name. Asking users to use the shift key to do anything is a pain and so I went without the final Q.
We’ll be following up with more blog posts about usage and the design choices made in Suzieq, at a rough clip of a post every day or two for the next week or so. We should’ve caught a bunch of niggling errors in the process and will release a second version of Suzieq very shortly after.
Edit: The display of interface top has been edited because of a bug, which has been fixed via commit 7e8a0bf