In data science there is a concept called Exploratory Data Analysis (EDA). When I have a big bunch of data, what’s in it? How do I make sense of it? Where do I even start? Just simple statistics about the dataset are not enough. In data analysis, this led to the S language, which led to S-Plus and then the current favorite analysis language R. In networking I think we have much of the same problem and we don’t have ways to systematically approach it. Because we don’t have good ways to explore our networks, we revert to manual gathering of data which takes a long time, or just educated guess, which can be wrong. This seems wildly insufficient, especially in the 2020s. It’s expensive especially in people.
EDA was defined by John W. Tukey in 1961. In his book Exploratory Data Analysis in 1977 he felt that there is too much emphasis on statistical testing, and not enough on understanding the data. I think we are in a similar situation in which we are not really looking at our network to understand how it operates. We rely on intuition and the general assumption that if users aren’t complaining, then everything is okay. The point is that a small number of statistics isn’t enough to understand the data (network) and we often aren’t even collecting all the data necessary to really know how the network is doing. You need to be able to look at the data, ask questions, find answers, ask more questions, etc. Just like in data analysis, not everything you want to examine is a metric. Also, I might not even know what question I want to ask yet, but I need to get oriented into the network (data) so I can even ask good questions.
The other networking discussions about this kind of approach are focused on looking at traffic, which is useful for some important problems. However, we need this same approach to understand how our network are operating. We need ways to be able to examine the operational data that is in the network and be able to orient ourselves in the network.
I like the points in this article Why EDA is Crucial for any Data Science Project.
- Get a better understanding of data
- Understanding data patterns
- Drawing charts and graphs for better understanding
- To get a better understanding of the problem statement
XNA (eXploratory Network Analysis)
Why does the idea of EDA matter to networking? We need better ways of understanding networks. How do you explore your network now to find out what protocols you are using, or if it is operating as expected? You look at configs, maybe you look at traffic graphs, and you probably have to log into devices to run show commands. But the configs are complicated and hard to get your head around. And the traffic graphs don’t represent how traffic flows or show the protocols in your network and that they are working as expected. You look at a diagram, if it’s up to date, at least you hope it is. If you are a consultant and need to make sense of a customer’s network, where do you start? If you are onboarding new network engineers to your team, where do you have them start?
Just like in data analysis, you need to be able to explore your network and find things easily. We need better approaches and systems to help us finding the context we need to design, build, operate, and scale the networks that we run. I’m going to discuss this idea in general, and talk about what we’ve implemented in Suzieq, the open source, multi-vendor network obseravbility tool, for XNA. One of the key reasons we built Suzieq is to be able to understand networks by exploring them.
There can be more than one type of exploring in networking. In one type you are looking for very specific pieces of data:
- Where is this IP address or MAC address?
- How often (and when) does this MAC move?
- Where did this MAC go? How many MACs do I have? Do I have any outliers that move a lot?
- How does a packet traverse through my network including L2, L3, and eVPN hops?
In another you are trying to understand the “shape” or characteristics of the network:
- What protocols do I have in my network?
- What is my topology, L1, L2, L3, per protocol?
- Do my L3 topologies have the same exact shape to my L1/L2?
- Why does my network work this way? For instance, where is it using eBGP vs iBGP, or symmetric vs asymmetric EVPN
- How many NOSes do I have? How many versions of each NOS? How many device types?
- What changed in the last 24 hours?
Most networks (AFAIK) have interface monitoring and graphs for metrics. Even with counters, for most monitoring systems there are not good ways to explore your data. You can usually point to a specific interface to see it’s utilization, which can give you some indication that your network is healthy, but not that it is working as expected. You want to ask more general questions like:
- How many interfaces are ever over 50% utilized?
- What percentage of interfaces 99th percentile is less then 20% utilization?
- If we change our TCP algorithm, will we have less drops in the network?
- How will the distribution of drops change?
- If we change our buffers, will we have less drops in the network?
- When will we run out of capacity and where will that be?
- What is the correlation between utilization and drops and is it the same across the network?
Suzieq is using standard data science tools like Python, Pandas, and Parquet. We’ve built network engineering and operations applications on top of that, but you can use a Jupyter notebook and do all the analysis yourself if you so desire. Jupyter is the standard interface for data science, so it can allow you to ask any question you can image. In Suzieq, in both the GUI and the CLI, we’ve designed it to be specific to networking, allowing a more intuitive approach to exploring your network.
Exploring a Network
As an aside, I’m going to be jumping back and forth between the Suzieq CLI and the Suzieq GUI, to show that they can do the same analysis and because it’s easier to get a clearer screen capture that is easy to read when I use the CLI over the GUI.
Let’s say that I’m new to a network, either I’m a consultant looking at my customer’s network for the first time or I’m a new operator at a company. I want to understand what it is in the network and how it works. I’ll start by looking at the devices in the network. 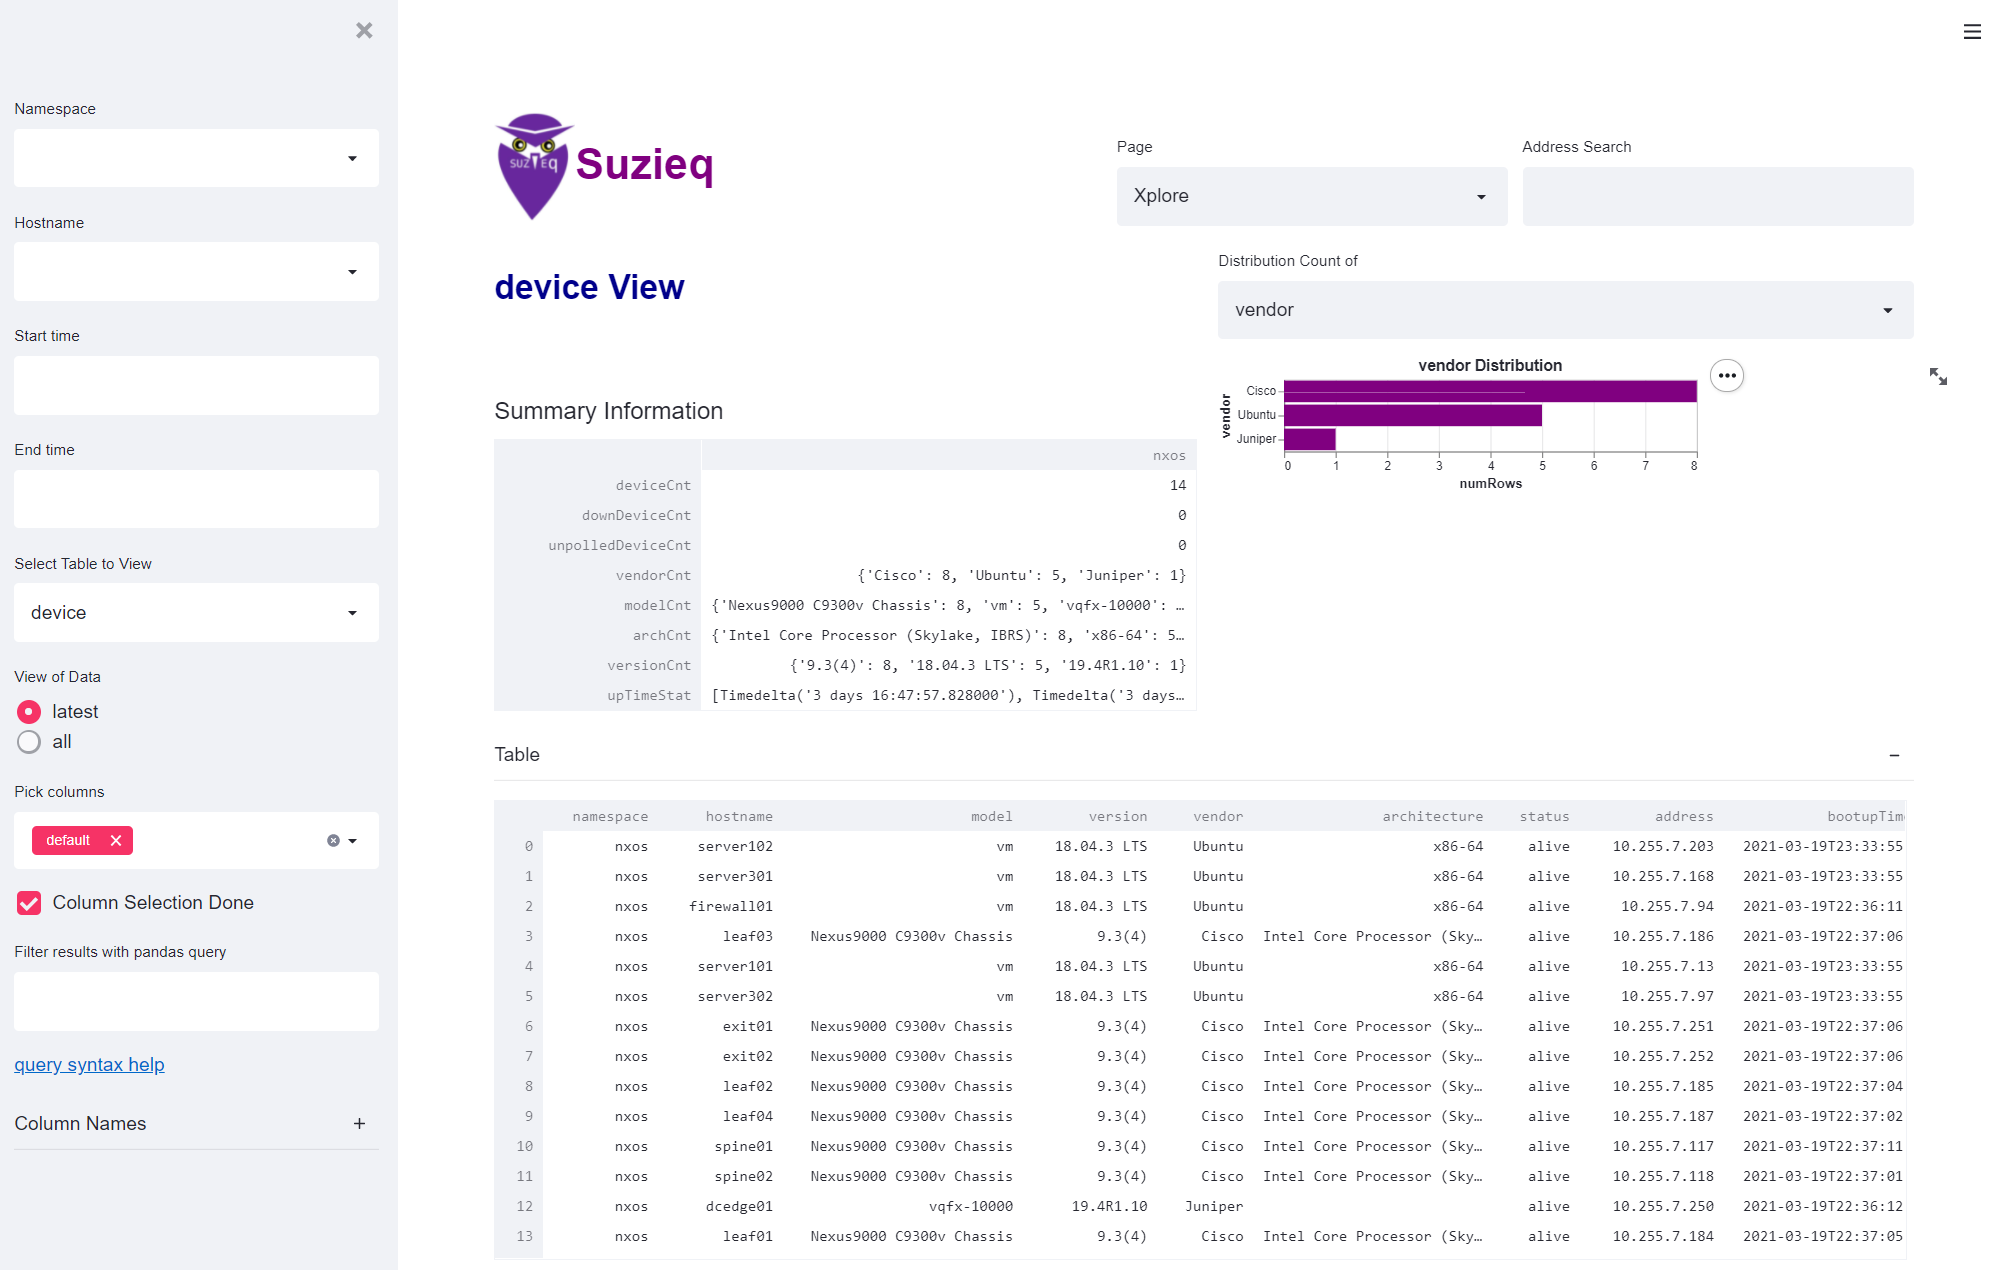 This gives you an idea of what devices are in your network. In this case there is just one namespace. Namespaces are a logical collection of devices in Suzieq. From the histogram on the top right, you can see the NOSes and how many devices in each. This is a pretty simple network, and all the OSes have just one version, which is nice. There are 14 total devices: 8 are Cisco, 5 Ubuntu servers, and 1 Juniper. No devices are down and they are all polled successfully.
Let’s look around, starting with routing protocols. As mentioned above, Suzieq collects operational state, like the OSPF neighbor information and BGP connections. You can view each of these, but for our purposes here to get a general overview, Suzieq has a summarize command which is the same information as the Summary Information in the GUI on the Xplore page.
First we’ll look at OSPF, using the CLI. 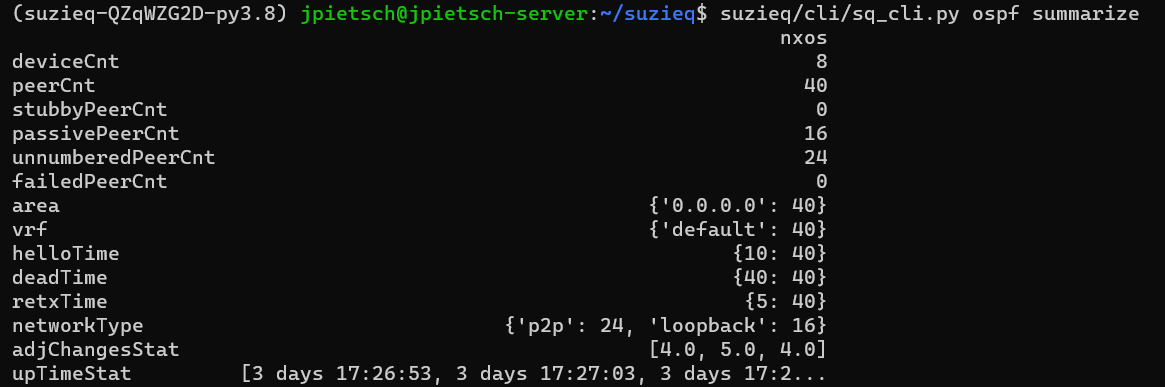 This gives you a good summary of OSPF in this network. There are 8 OSPF speakers, all in the same area 0, all in the same VRF. You can see the important OSPF timers as well. There are 24 unnumbered Peers, which is pretty cool. In this network there aren’t any ABRs, but if there were, I’d like to see how many there are. One odd thing is the 16 passive Peer connections. What are those? Let’s see if we can figure that out. We can look at individual OSPF sessions with ‘ospf show’ and we can filter by the sessions that are passive.
 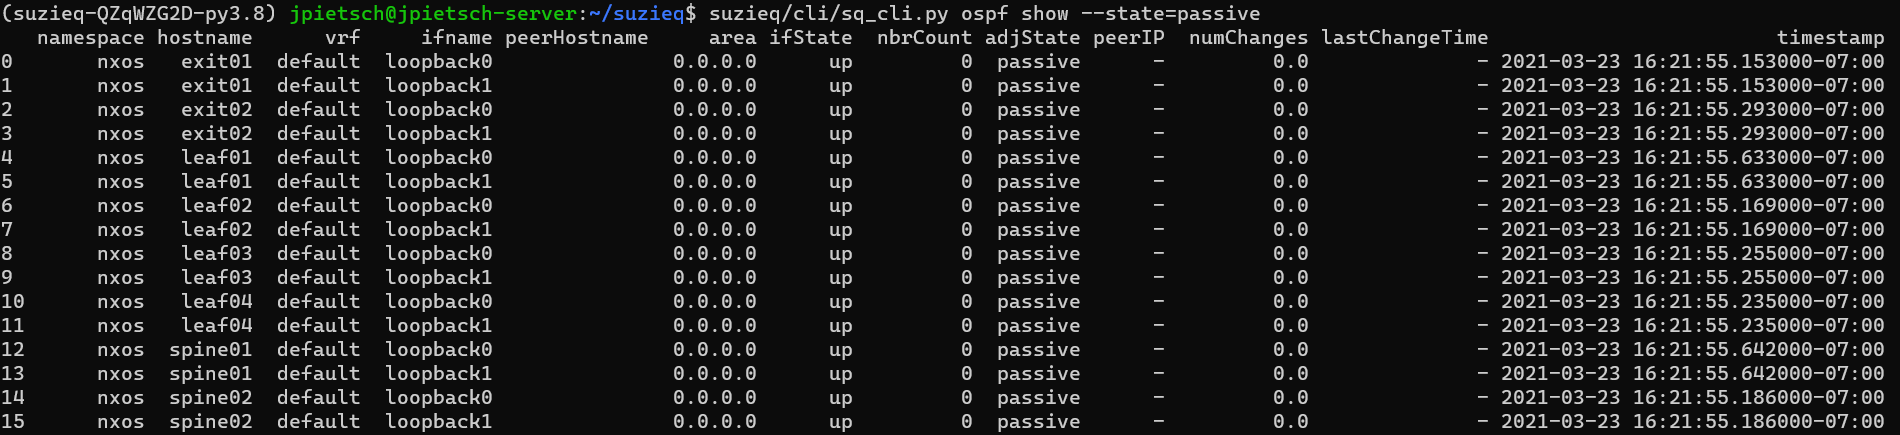 This shows us that the passive interfaces are all loopback interfaces. That seems fine, so nothing to worry about.
How about BGP?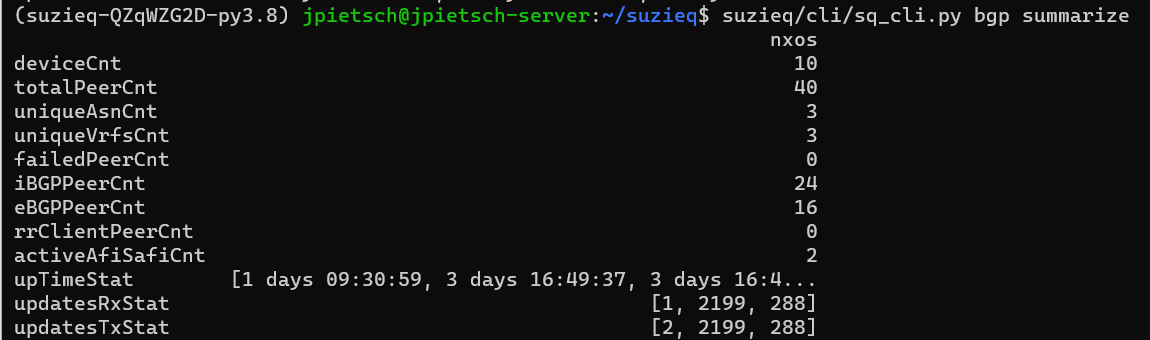 There are 10 BGP speakers; interestingly different than the number of OSPF speakers. Let’s look at that. We can use the unique verb for both ospf and bgp to show us what hosts are participating in each.
 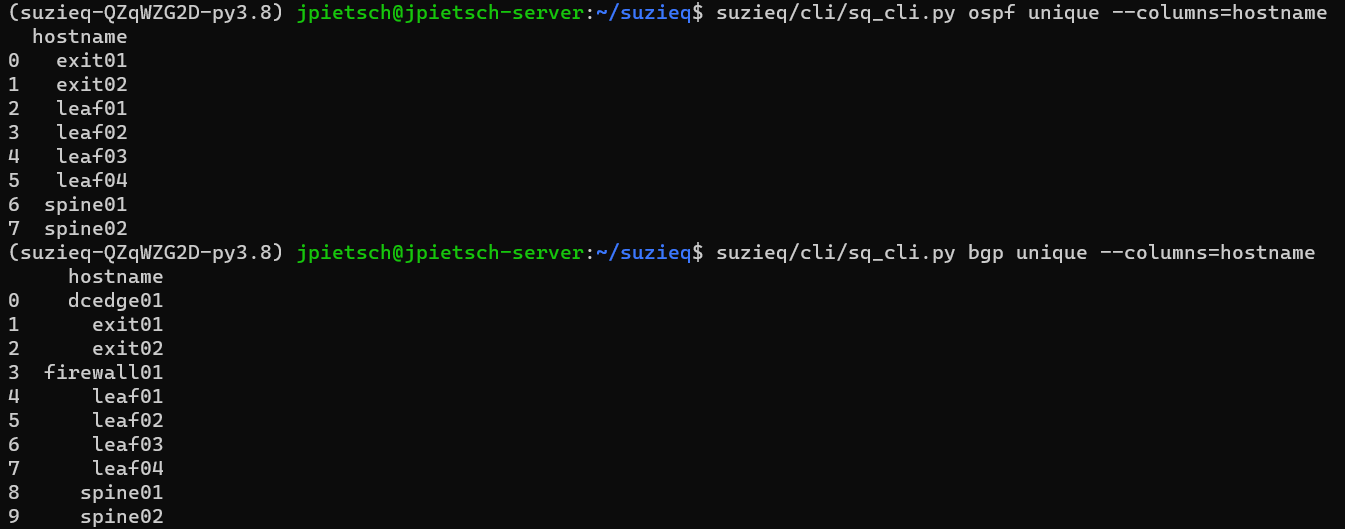 Ah, BGP has dcedge01 and firewall01 devices that OSPF doesn’t have. That makes sense.
Let’s get back to BGP, there is eBGP, and iBGP, no Route Reflectors, 3 VRFs, and 3 ASNs. We see that there are 2 active Afi/Safis. Let’s look to see what those are.  This shows us we have IPv4 and EVPN. Because I used the count=True flag, we can see that there are 24 l2vpn evpn sessions. In the summary above, one of the interesting things is the 24 iBGP and 16 eBGP sessions. We can assume that the 24 iBGP for eVPN and the eBGP are for something else. Let’s dive in and confirm. We’ve recently added a query-str parameter in Suzieq for advanced uses so that you can directly perform pandas queries if Suzieq does not already support the operation.
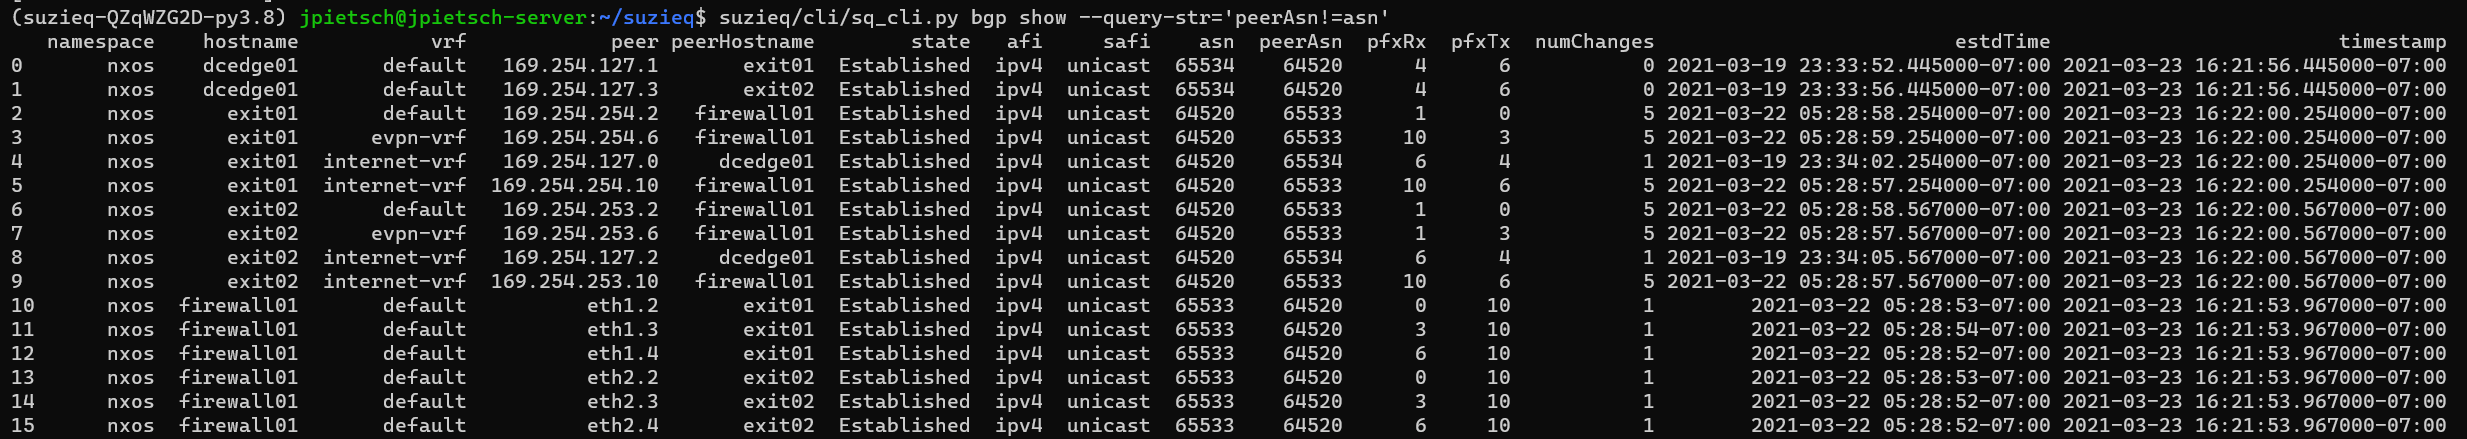 This shows, as expected, all the eBGP peers are to/from the dcedge01 and firewall01 devices.
If you really want to look at BGP, Suzieq is collecting more data than is shown by default. To see all the data that is being collected for a table, use table describe. 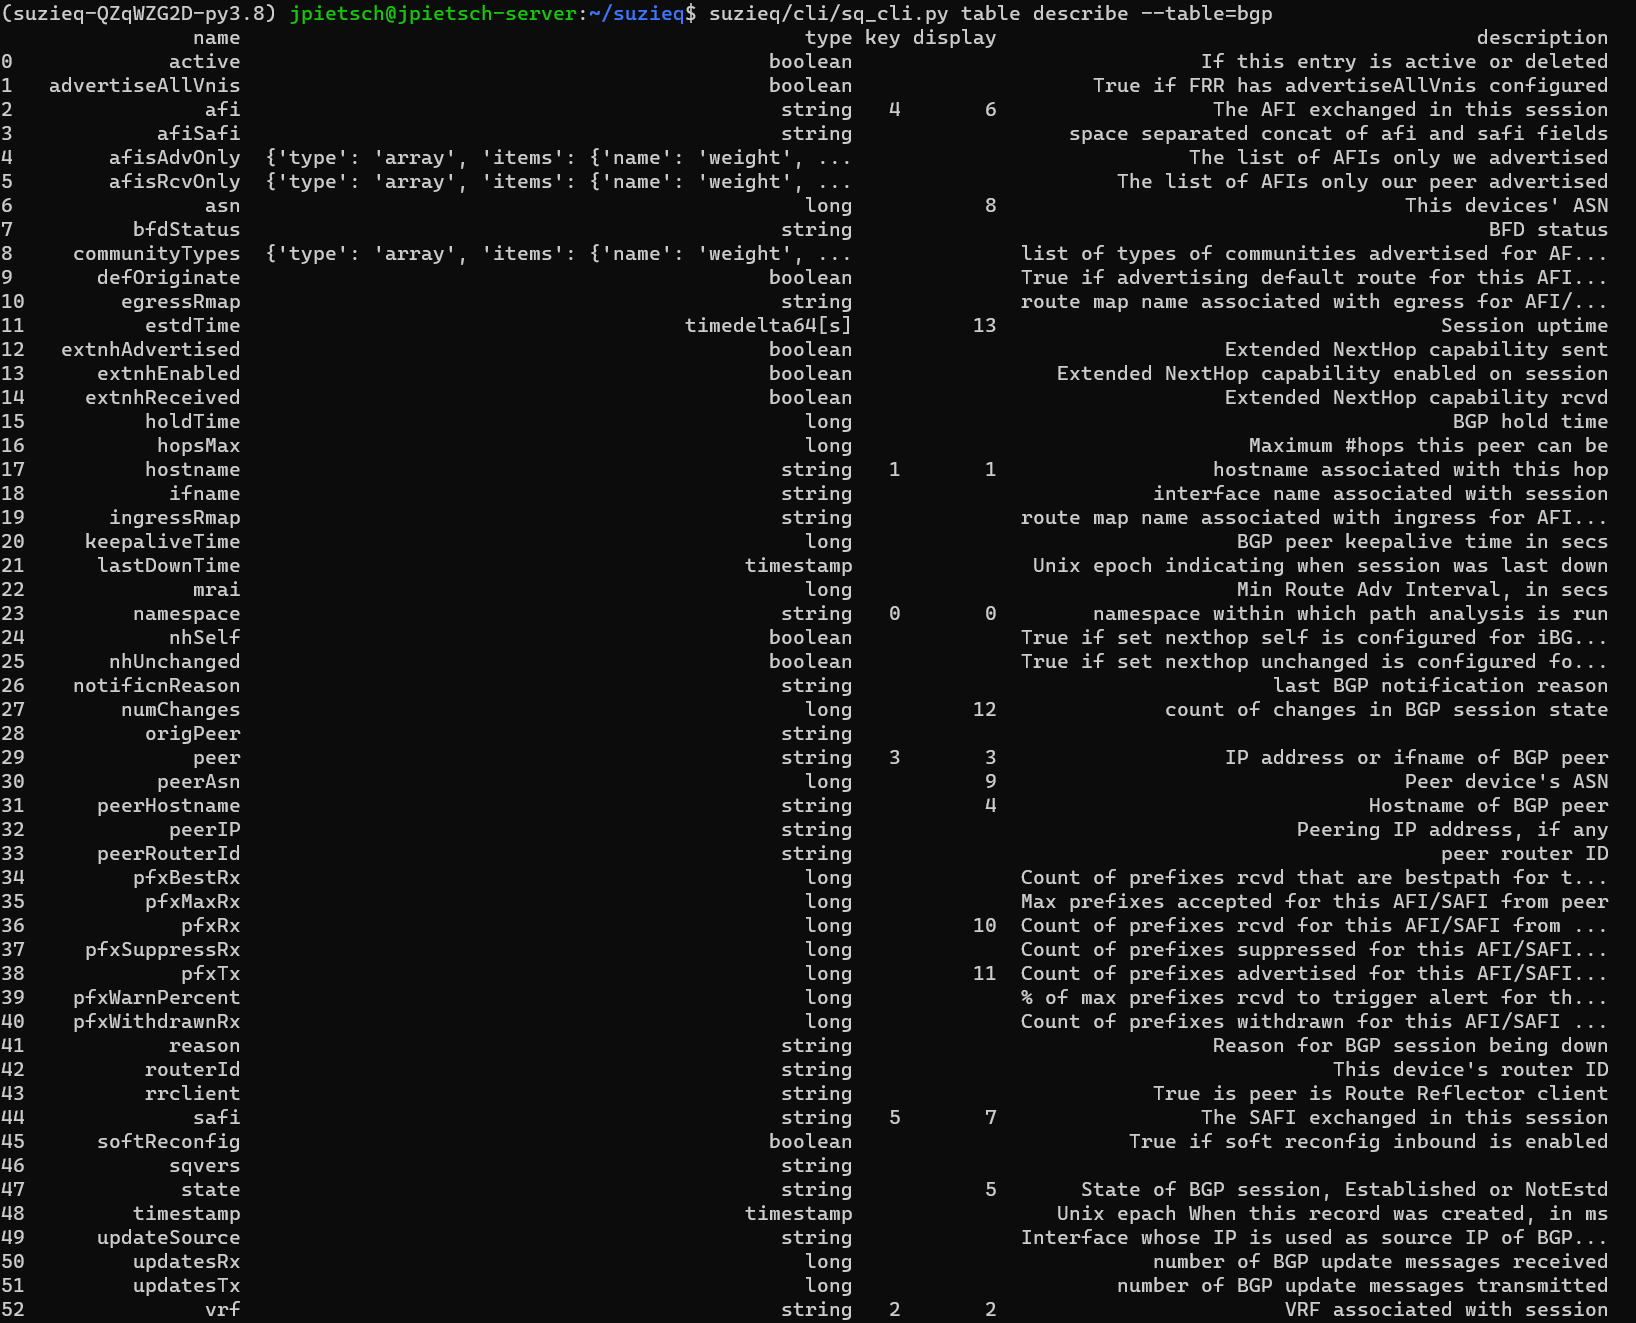 We’re not going to look at those all now, I just want to demonstrate what is available.
We can look at EVPN to get an an overview also. It’s symmetric EVPN, some L2 and L3, and no multicast.
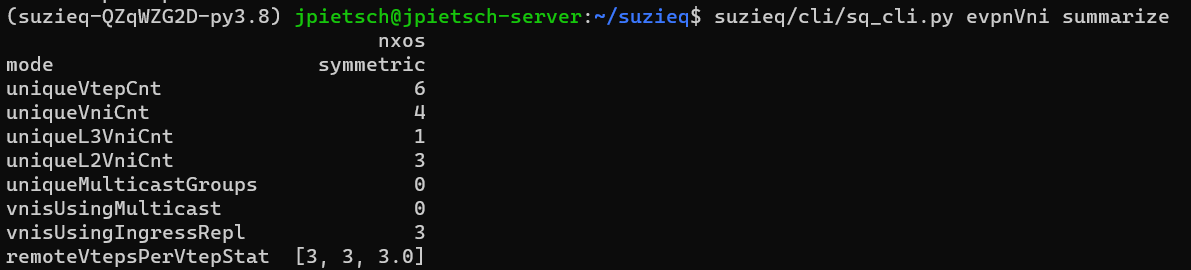
From these summaries we know what protocols we have, and a summary of each one. This gave us a pretty good overview and understanding of this network.
Path Trace
Sometimes you need to dive into a particular question to understand your network. Suzieq can show you the forwarding decisions that routers make from a source, destination pair with the path command. We know that there is eVPN in this network. Let’s see what happens when we trace the path between two servers that are on different ToR switches.
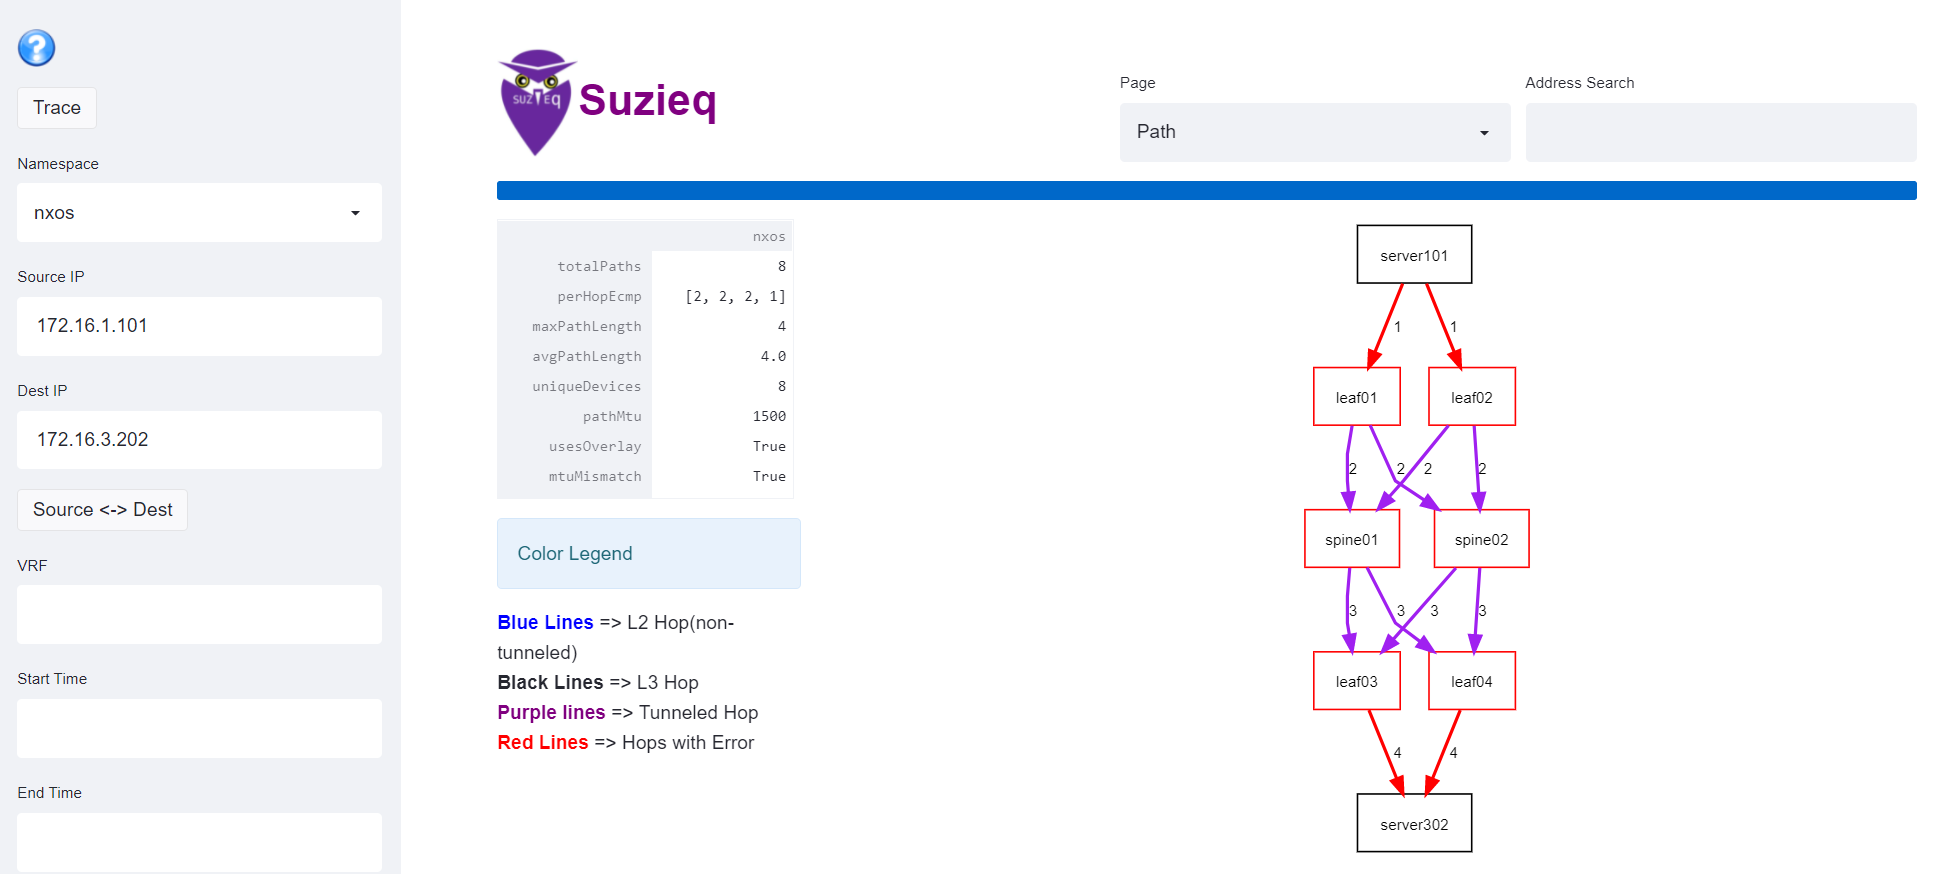 You can see that it’s going from one server to another, the first and last hops are L2 and in the middle are tunnels. The first and last hops are colored red. I can’t show the screenshot here, but if you over over one of the red links from server101, a table shows with all the information about that hop, including that the MTU of the source is 1500 and the destination is 9200. The same information is in the table at the bottom. You can see from the first two hops the MTUs.
Clicking on any link allows you to understand what decisions are made. Click the link spine01 to exit01, you will see how the forwarding decisions are made. 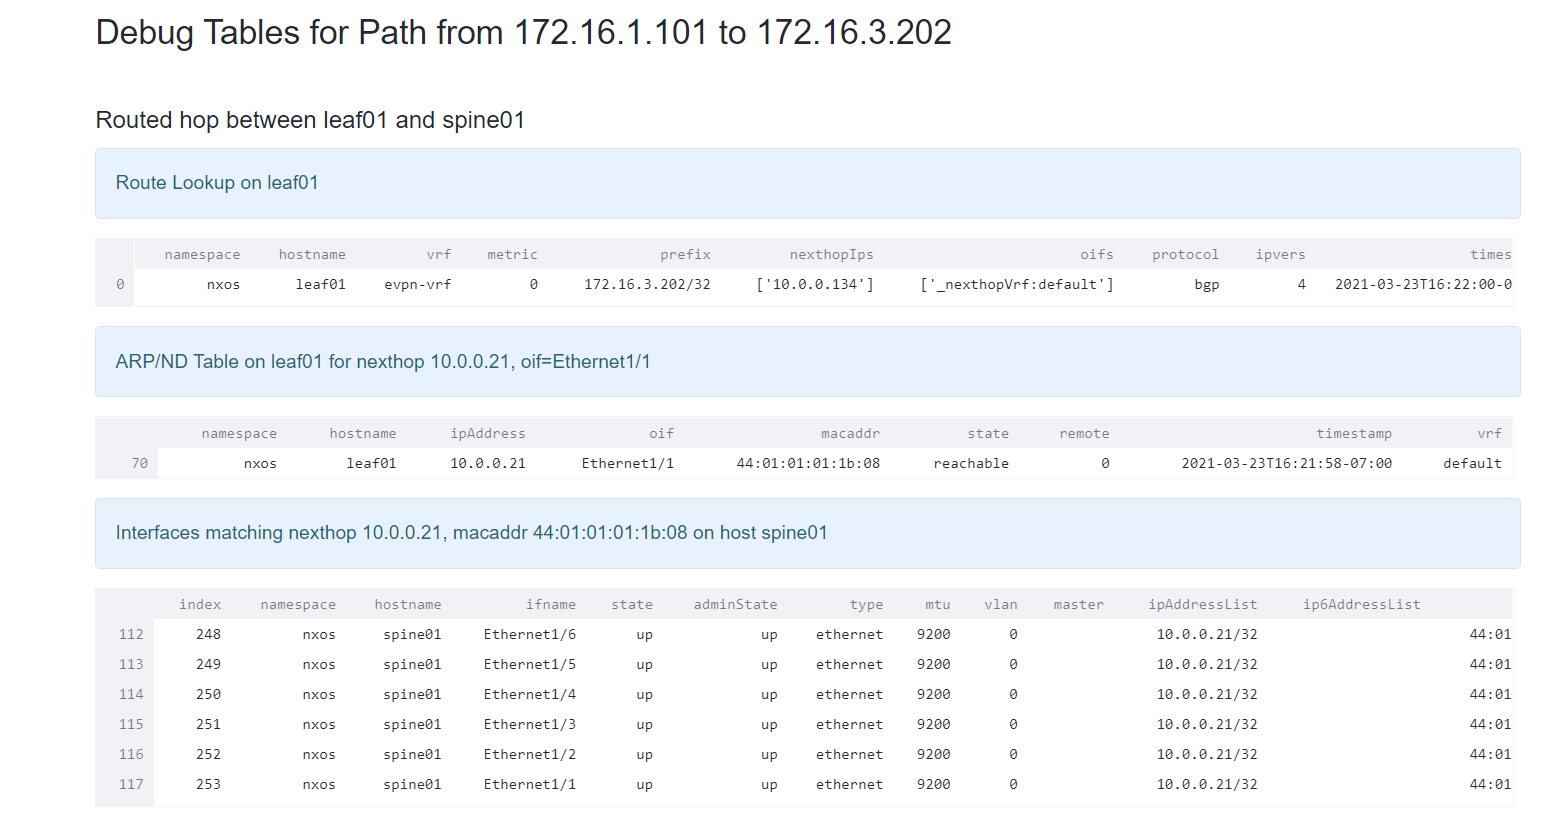 You can see all the forwarding decisions for that hop and that the route was populated by BGP.
Let’s get an idea of what’s in the routing table. 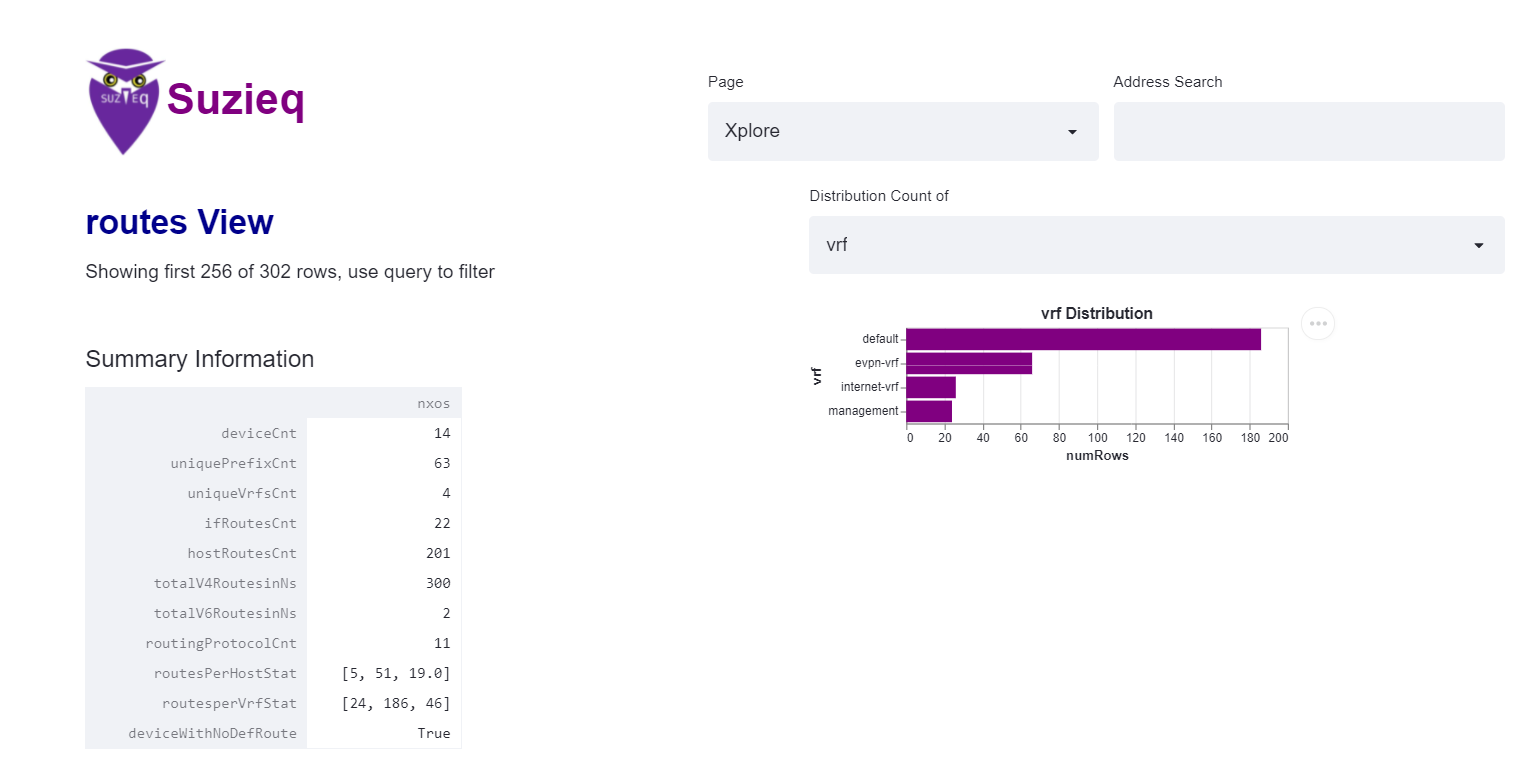 The summary is a great place to start again. You can see the number of devices and total number of prefixes, host route count, IPv4 and IPv6 addresses, etc. In Suzieq Summary, anytime there is something named *Cnt, that is a list of things that might be interesting. You can use the Distribution Count in the GUI or the unique command in the CLI to dive into what the values are. In this case, we see there are 4 VRFs, and so we want to see which 4 VRFs they are and how many routes are in each VRF.
We can explore more, for instance, there are 11 protocols in the routes table, so we can see what they are and how many routes are from each of the protocols. 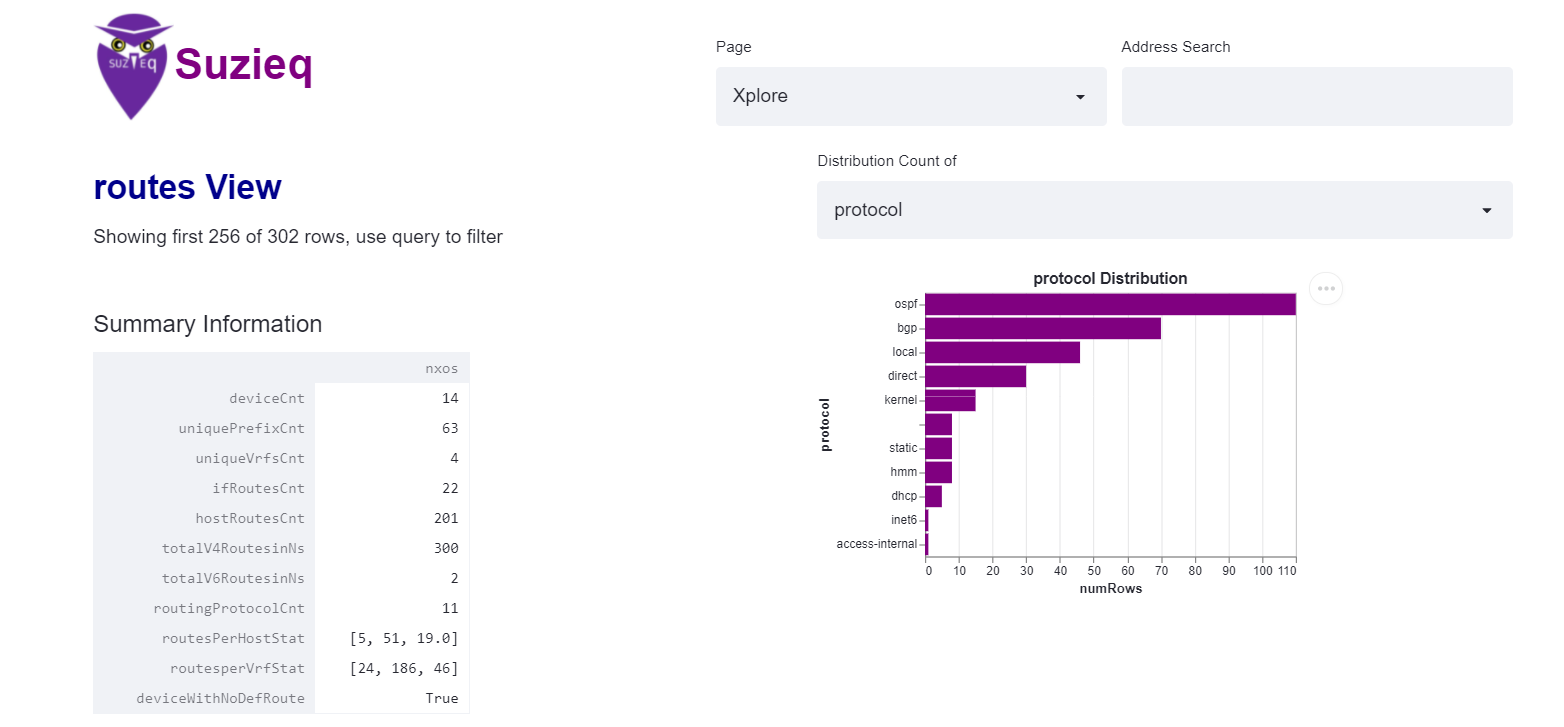 That looks like the protocols I expect, and some weird NXOS stuff that seems fine.
Deep Dive
I’ve most showed how to get an overview of your network with Suzieq, but if you want to dive in deep, Suzieq gives you that ability also.
We have a screencast that goes into depth on investigating various aspects of MTU in your network
We have a screencast to show off Path Trace:
And a have longer dive into troubleshooting Path with Suzieq:
How is this different than Observability
We’ve written about Network Observability and it is very related to this area of XNA, it’s just coming from a different field (Devops vs Statistics and Data Analysis). Observability focuses on being able to ask arbitrary questions in your network just like XNA. I would say that a good observability platform is the basis and foundation to do this kind of Exploration. The point of EDA and XNA is to enable the exploration that is needed.
Conclusion
We all need good ways to explore what’s in our network. We need better tools to allow us to do this. Suzieq is the one I’m familiar with. We built it so that we could do this kind of analysis. The important idea is to think about how to explore your network so that you can really understand how it works as opposed to how you might imagine how it works. Being able to explore your network gives you a better intuition about how it works.
I’d love a discussion about the ideas in general, and any ideas on how to make Suzieq even better at eXploratory Network Analysis. We are accepting PRs :). Suzieq is currently focused on operational state in network devices. Suzieq does not currently answer all the exploratory questions I’d like to ask of a network, but it’s a very good start.
Suzieq
Try out Suzieq, our open source, multivendor tool for network observability and understanding. Suzieq collects operational state in your network and lets you find, validate, and explore your network.
Conversation
- How do you explore, find, and understand your network today?
- Are there things you’d like to investigate that are too hard right now?
- Try out Suzieq
- When you’ve tried out Suzieq, what would you like to help you explore, find, and understand your network?