We haven’t blogged for three months. We’ve been busy working on Suzieq, adding features and figuring out where we want it to go. We haven’t blogged about Suzieq for even longer. Since we last blogged about Suzieq, we’ve added tons of new features and platforms. In no specific order, we’ve added support for:
- NXOS, Junos (QFX, MX and EX), and SONIC
- REST API
- Schema Evolution
- Enhanced asserts such as interface asserts
- Support for gathering data and displaying data efficiently from routers having full Internet route feeds
- Added many SSH security features required to run in production such as passphrase-protected private key files, jump hosts and more
- Topology as a first class citizen, still an alpha-level feature
Suzieq has had a CLI that was geared to be friendly to network operators. However, a tool like Suzieq typically needs a GUI. And finally with the 0.8.0 release, we’ve added a GUI, and with our latest 0.8.5 release, improved the visual experience of path tracing.
GUIs are tricky things to get right, especially if you’re not a visual person. Typically, the effort involved in putting together a functional GUI takes a long time. But thanks to the advent of modern open source GUI frameworks, this task has considerably gotten easier. And in Streamlit, we discovered a fairly ideal mix of effort to reward ratio. We don’t think the GUI we have is enterprise class, in terms of aesthetic look and feel, but we don’t think it’s ugly, and we like to think it’s actually useful and shows off the power of Suzieq better than the CLI does. In the coming weeks we’ll be putting out screencasts highlighting the GUI, and of course we’ll continue to improve it. Like much of Suzieq, the GUI is still in its early form, with much more to follow in the next few releases.
GUI Architecture and Tools
We decided to use Streamlit as the framework to build out the GUI. We picked Streamlit because its an excellent framework to build a web-based GUI if you’re comfortable with Python but lack the chops to use Javascript, HTML and CSS. The default look and feel is quite good. It is not without its share of troubles, which will be the subject of another post, but overall we think it is an excellent fit for Suzieq at this time.
The GUI is quite modular, allowing the easy addition of new functionality without requiring the need to touch existing code. The GUI is broken down into pages, with each page coded up in its own file. So its easy for users to add their own custom pages, and for us to accept third-party contributions. Of course, it also makes it easy for us to add features ourselves, as we intend to do in the upcoming releases.
Overview of the GUI Pages
As of 0.8.5 release, we have essentially four pages: Status, Xplore, Path and Search. Lets look at each of them briefly.
Status
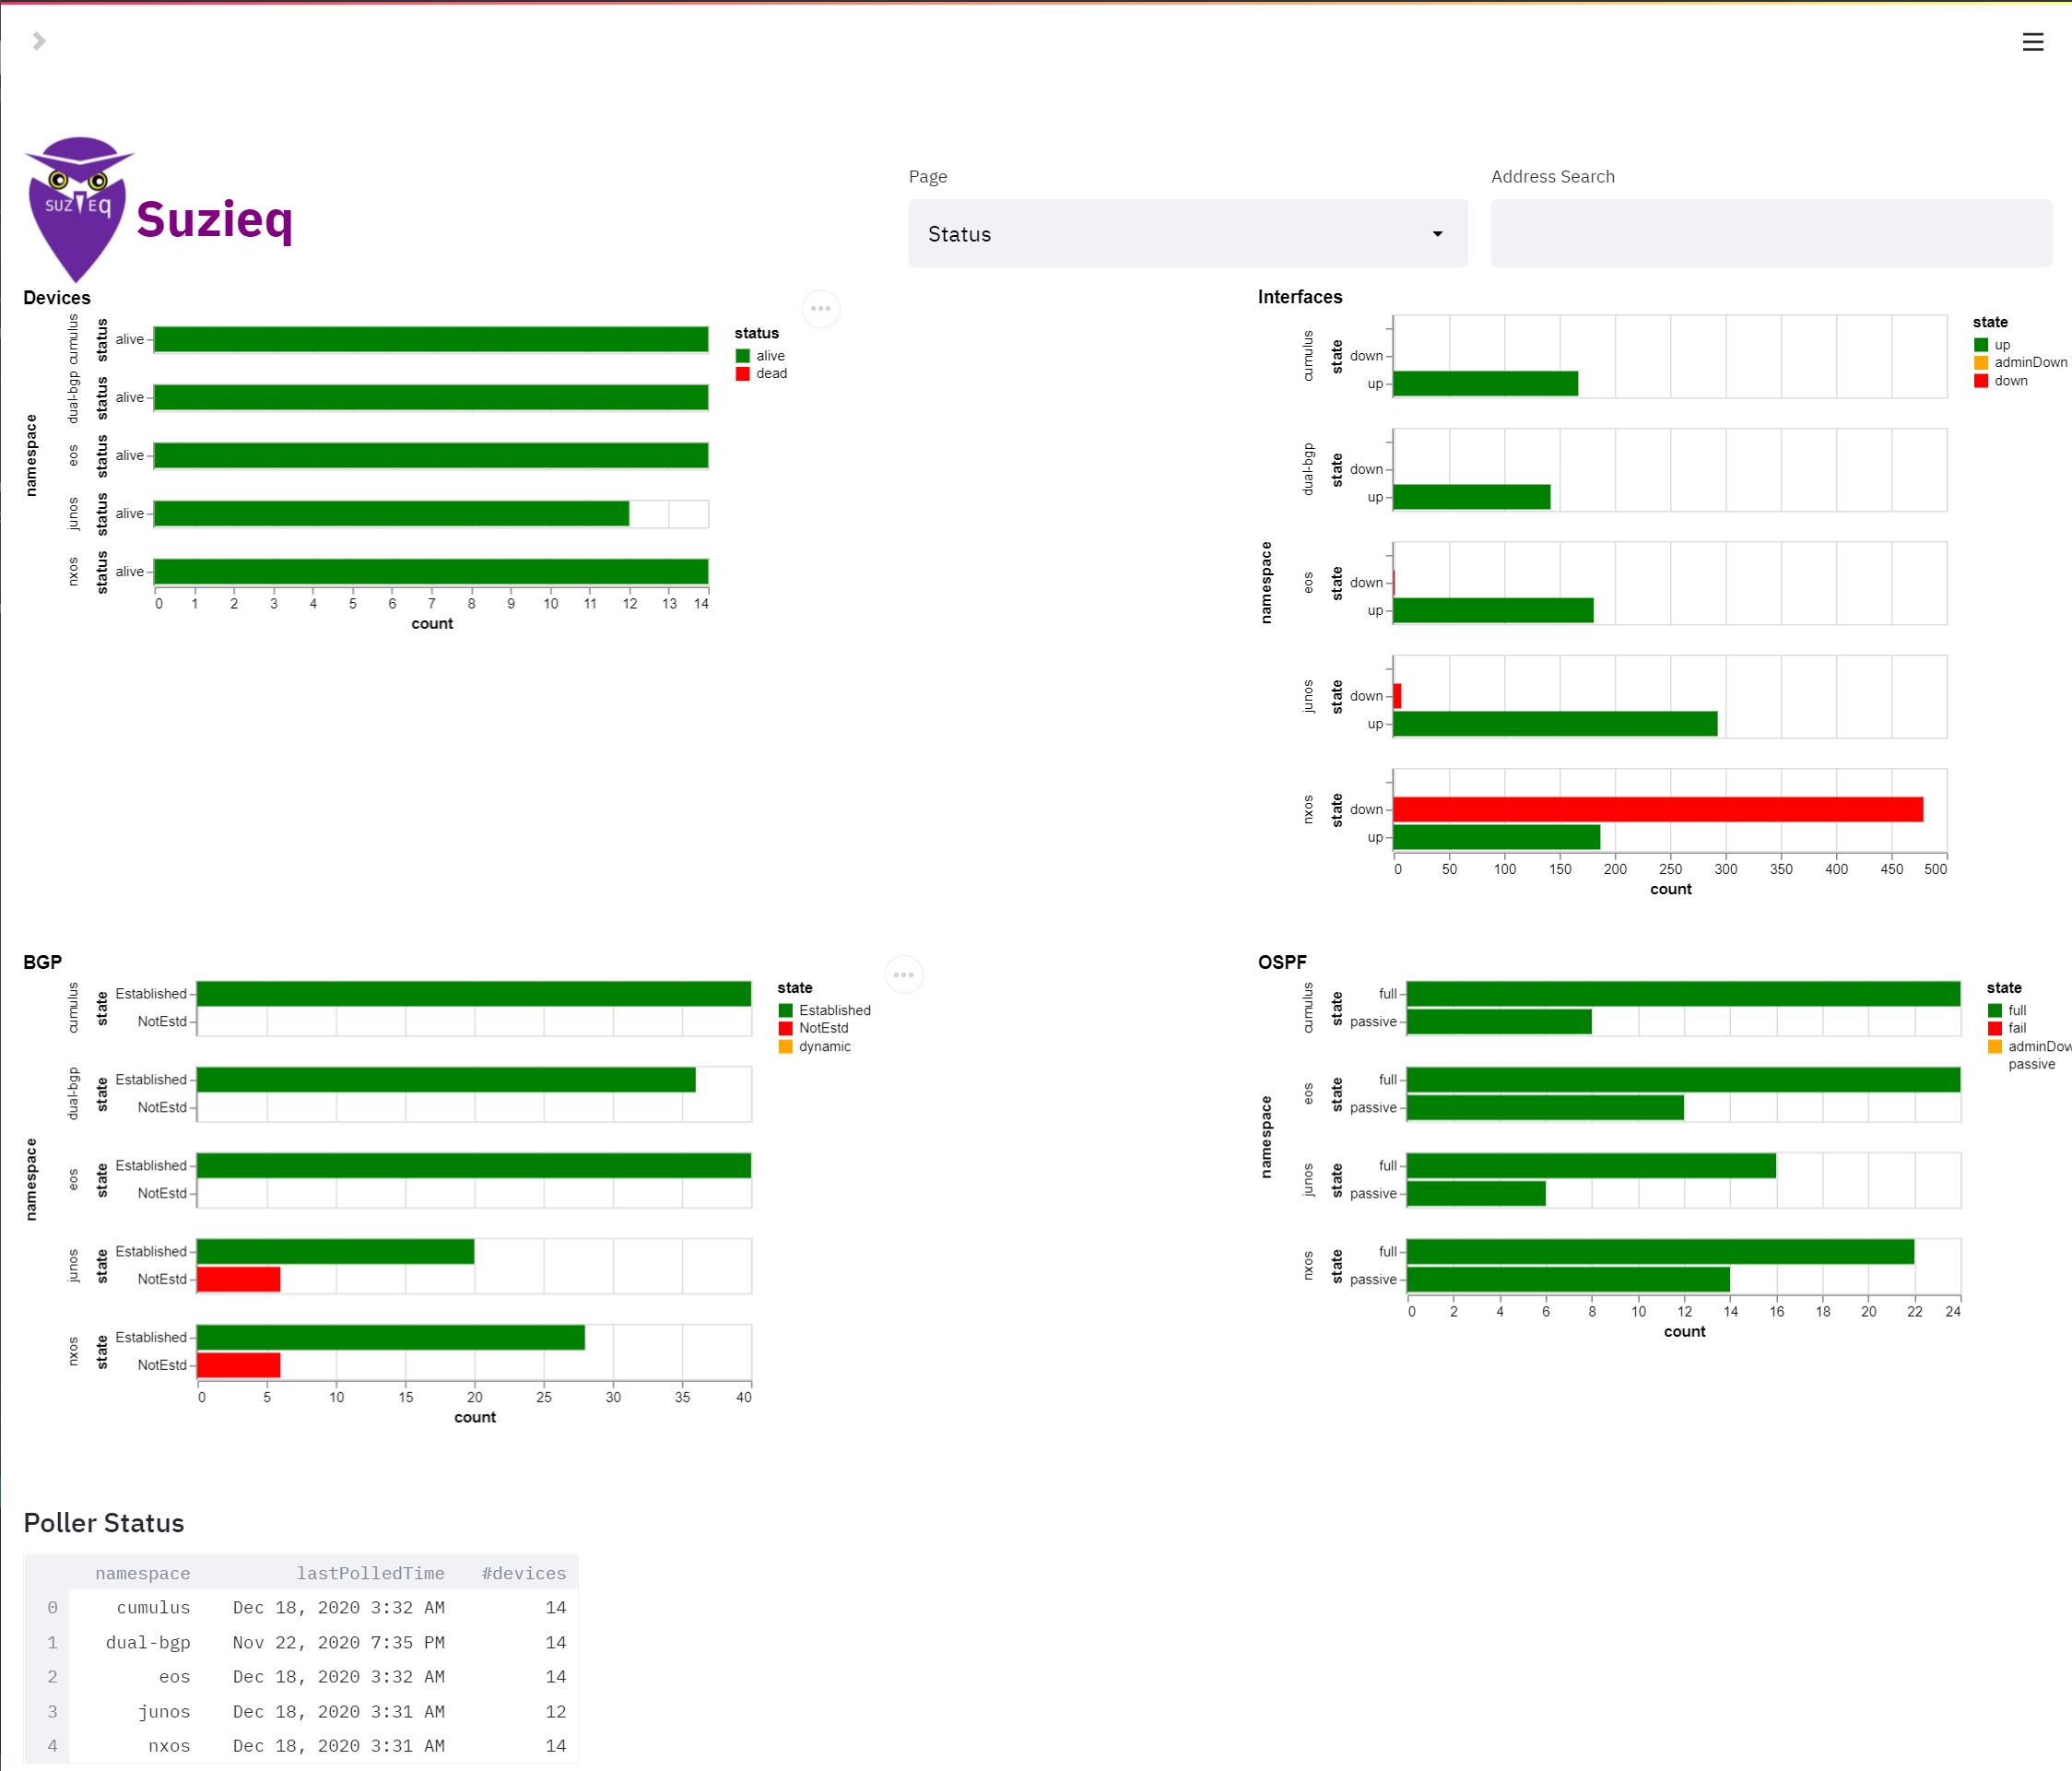
With the GUI, Suzieq now has a way to show the status of the network. With this release you can see the potential. 
As you can see, in its present form, the status page is used to highlight for each namespace, the status of key resources across the network that Suzieq is monitoring:
- Alive and dead devices
- Up and down interfaces
- OSPF and BGP peering state
There’s a refresh button to update the cache.
Xplore
Suzieq has always been about exploring your network. The show command which gives table of data for a service, such as the route table. Suzieq also has the ability to summarize data and to provide histograms of the data. With the GUI, Suzieq can show all of that together and it represents how these different presentations are useful together.
In the Xplore page, you first see a view of the devices. There is a summary table at the top left to help you make sense of all the data. 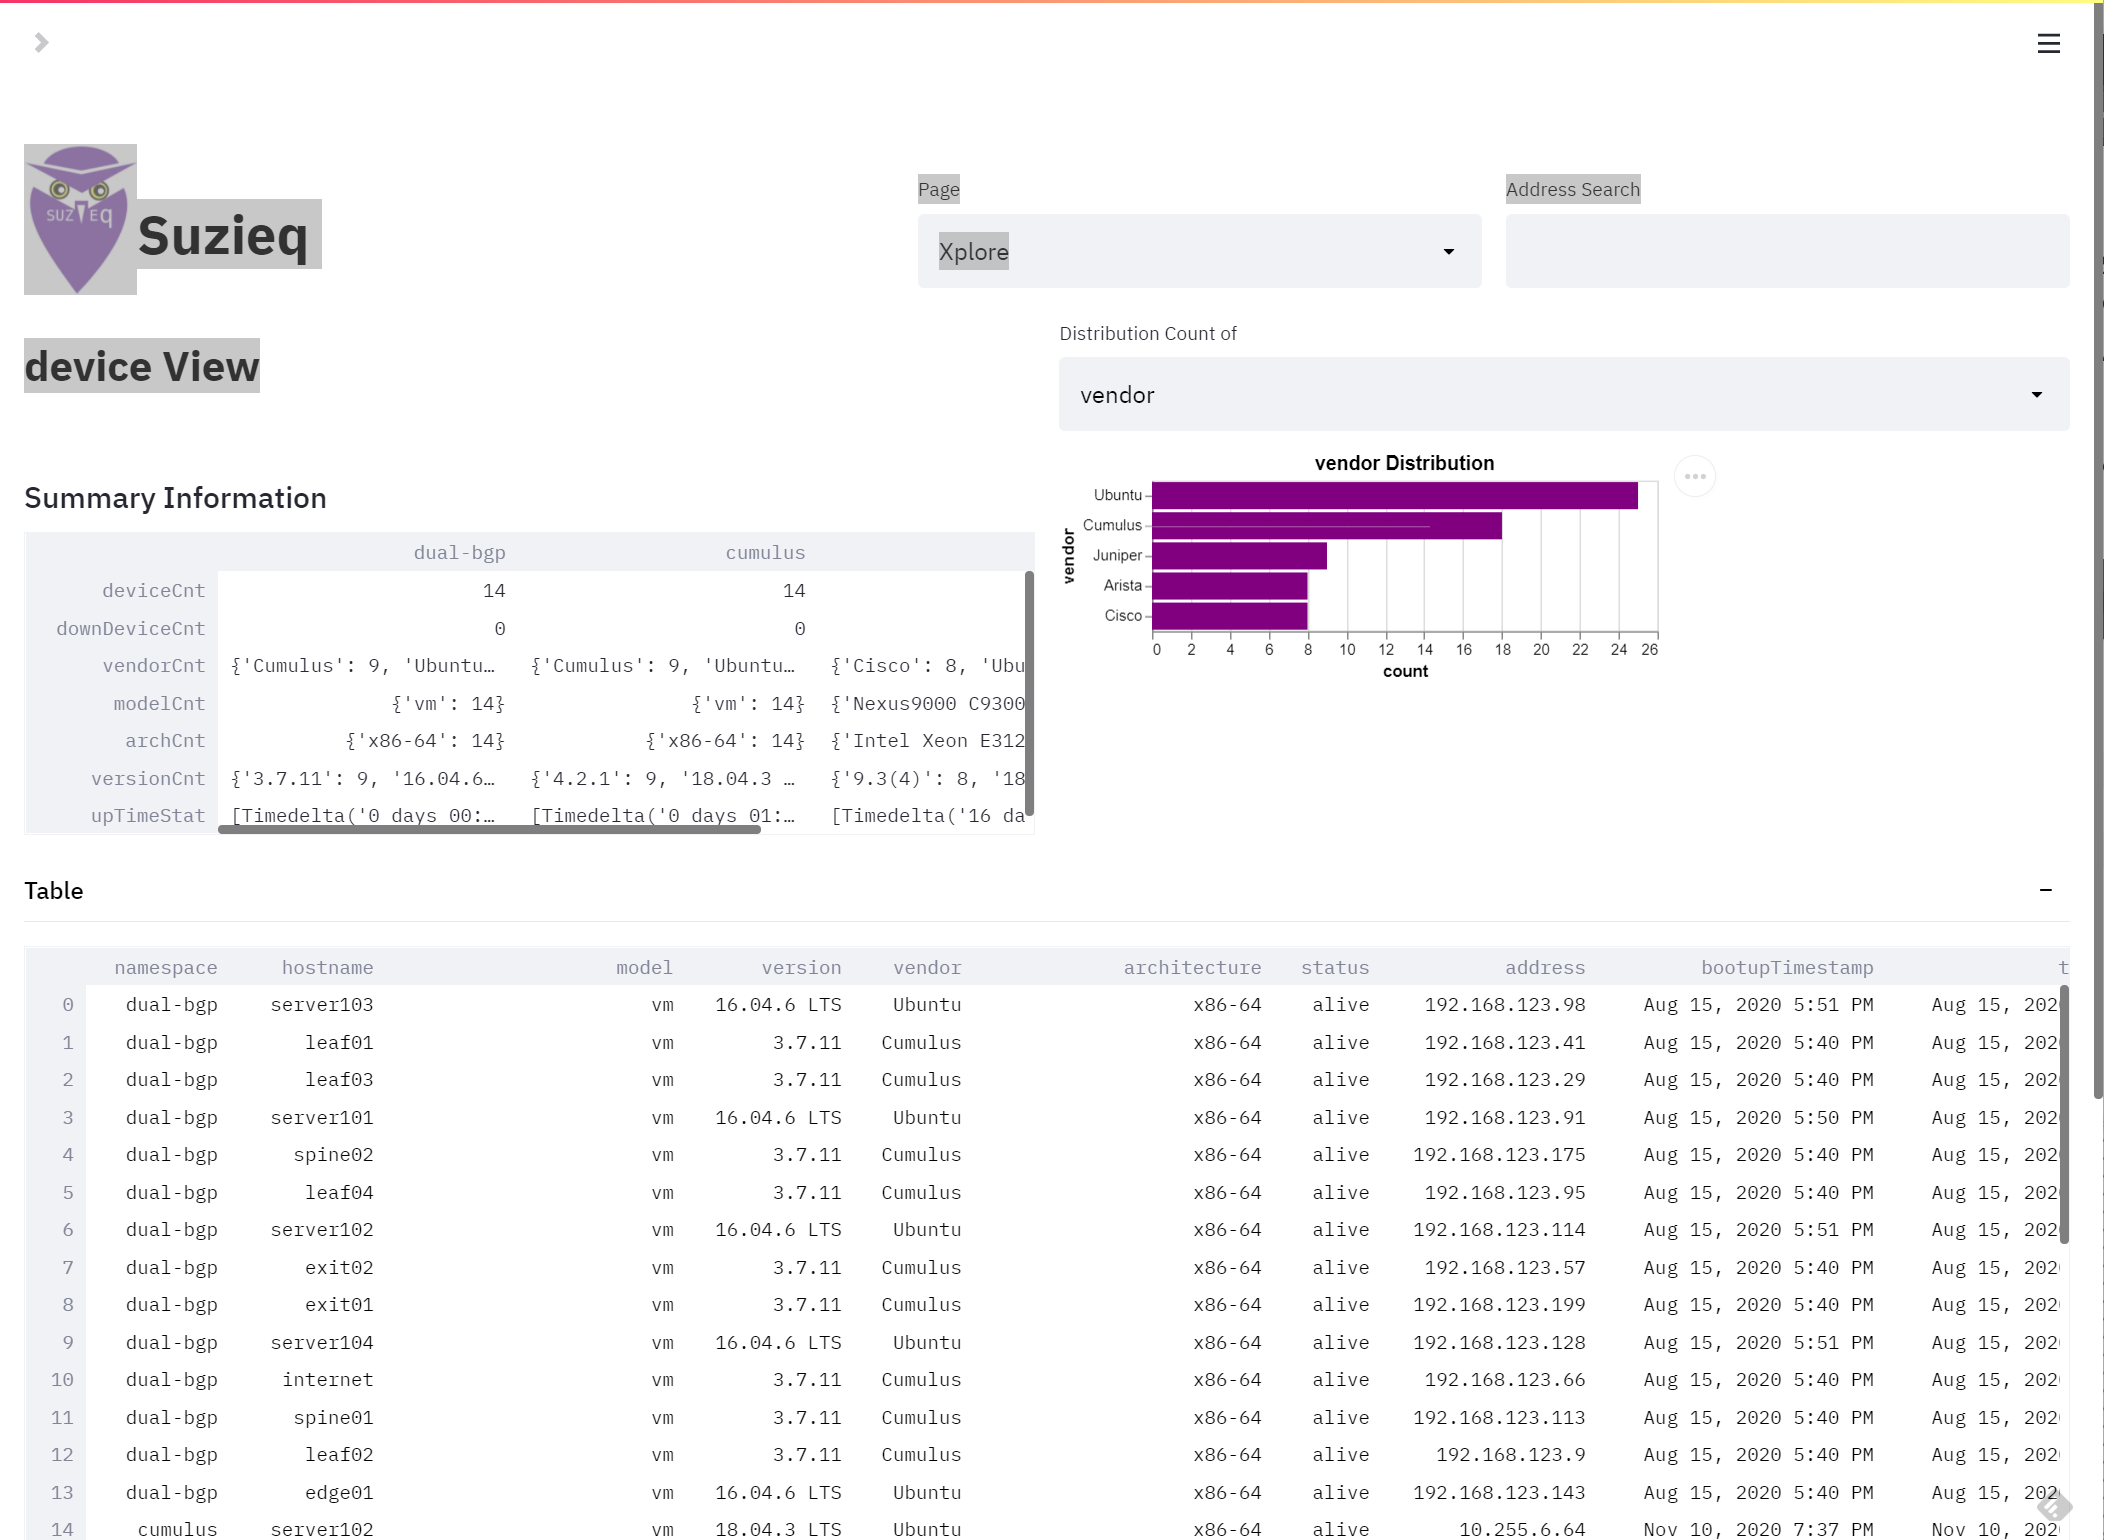 The Distribution Count section lets you pick any of the columns that you want to look at histograms.
In this example, we look at routes. In the summary table you can see how many IPv4 and V6 routes, how many are host routes, a distribution of routes per device, etc. 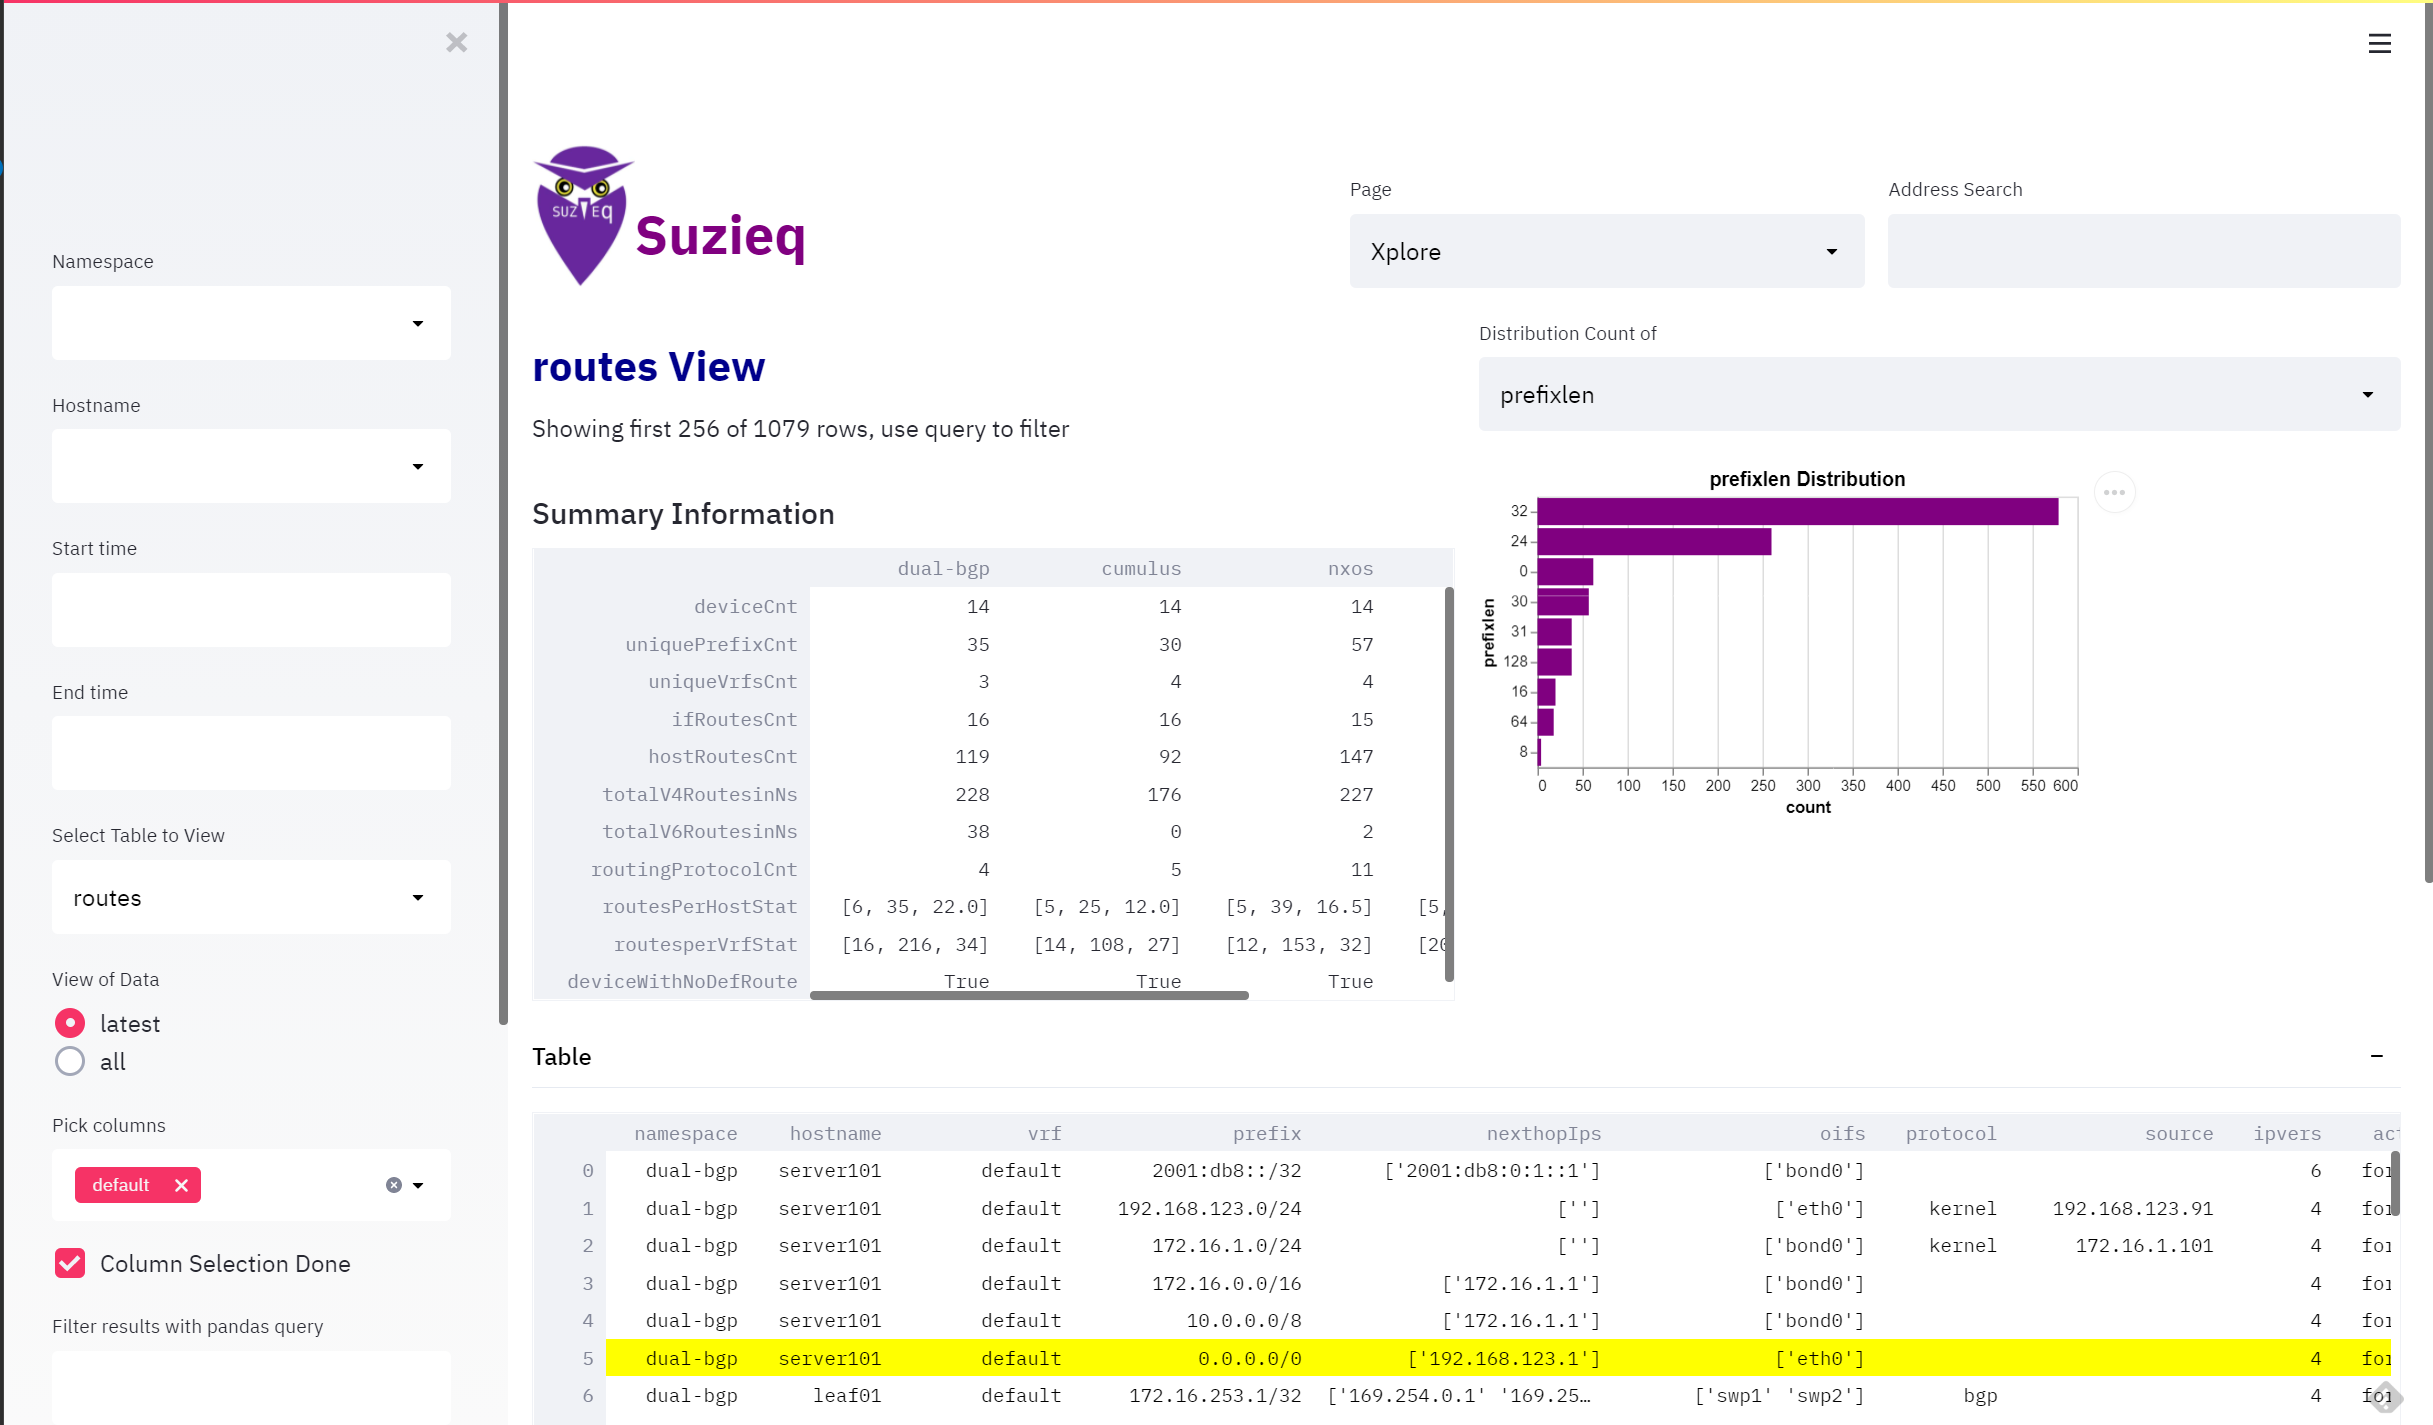
One fun example is this data with a router that has a full IPv4 internet table. You can see the prefix length distribution. 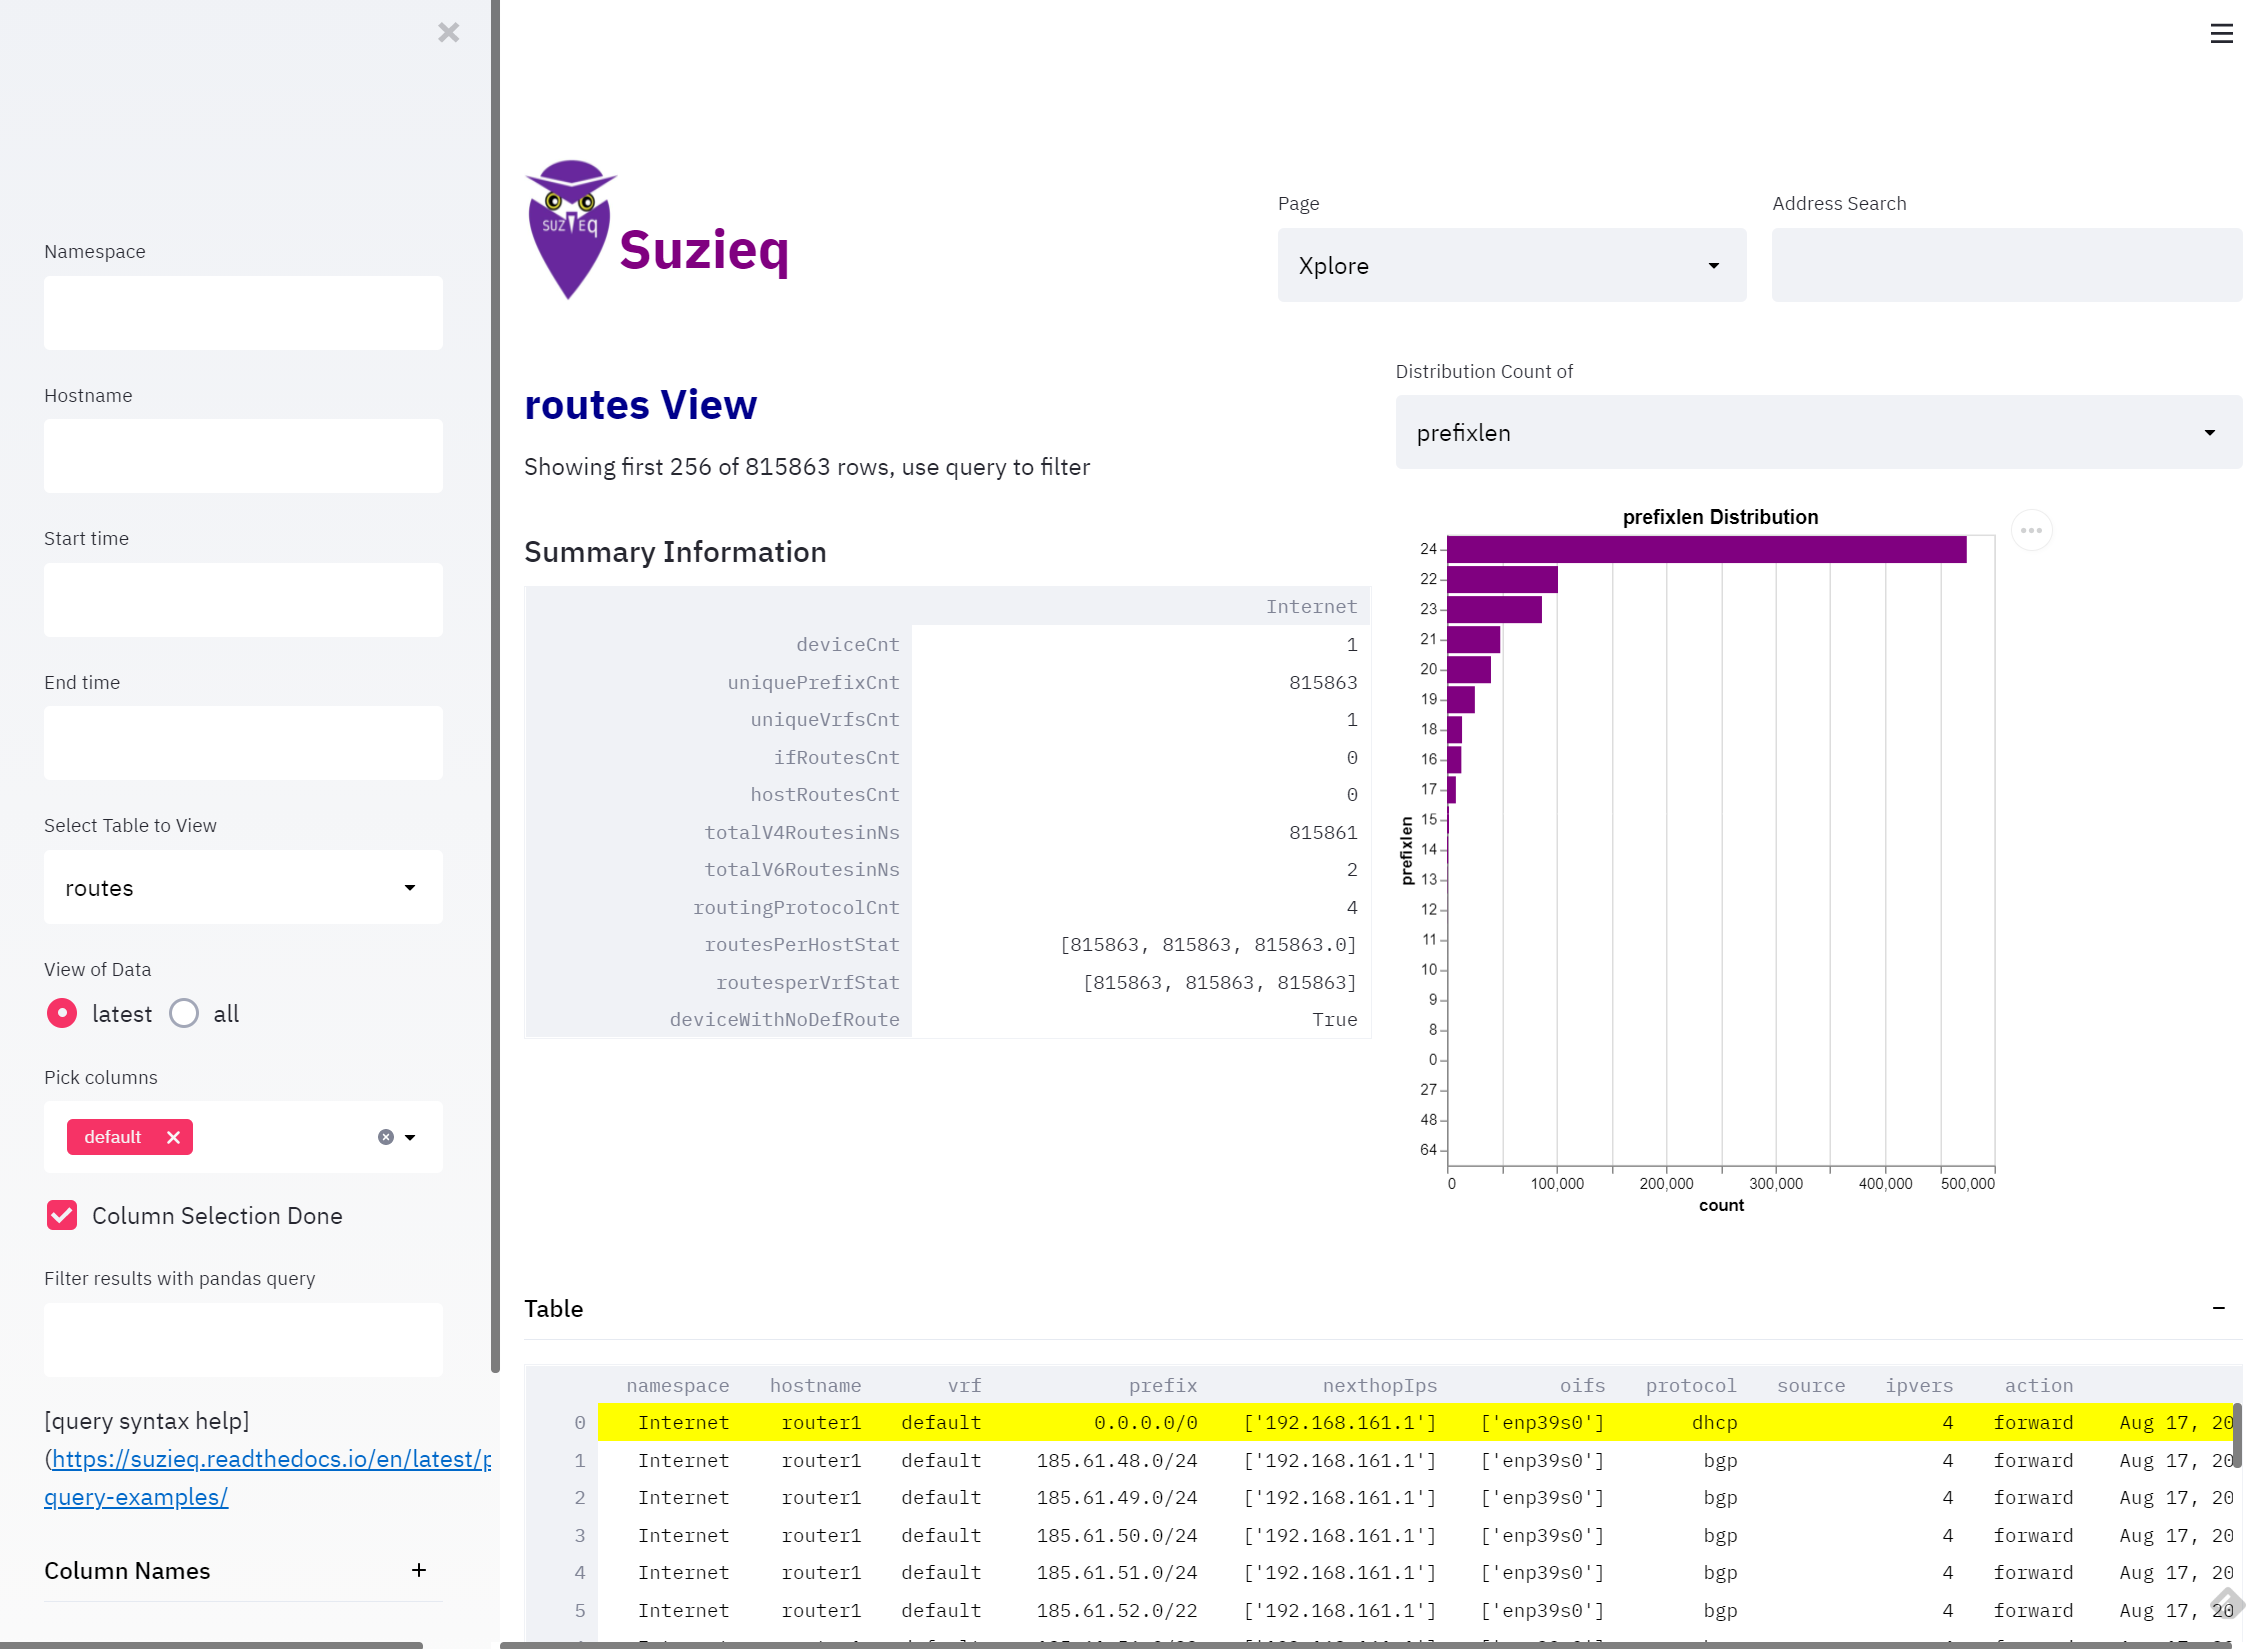
There are so many things to Xplore with Suzieq, and future posts will highlight how to use the Xplore page to explore your network.
Path Trace
Suzieq has always had the ability to show all the paths between two source and dest IPs. We’ve continued to improve it’s ability to deal with all the different aspects of forwarding such as overlays. With the GUI, we can even show you what it looks like and you can spot inconsistencies in your path. Version 0.8.5 has added more information to help troubleshoot when you see something you don’t expect. 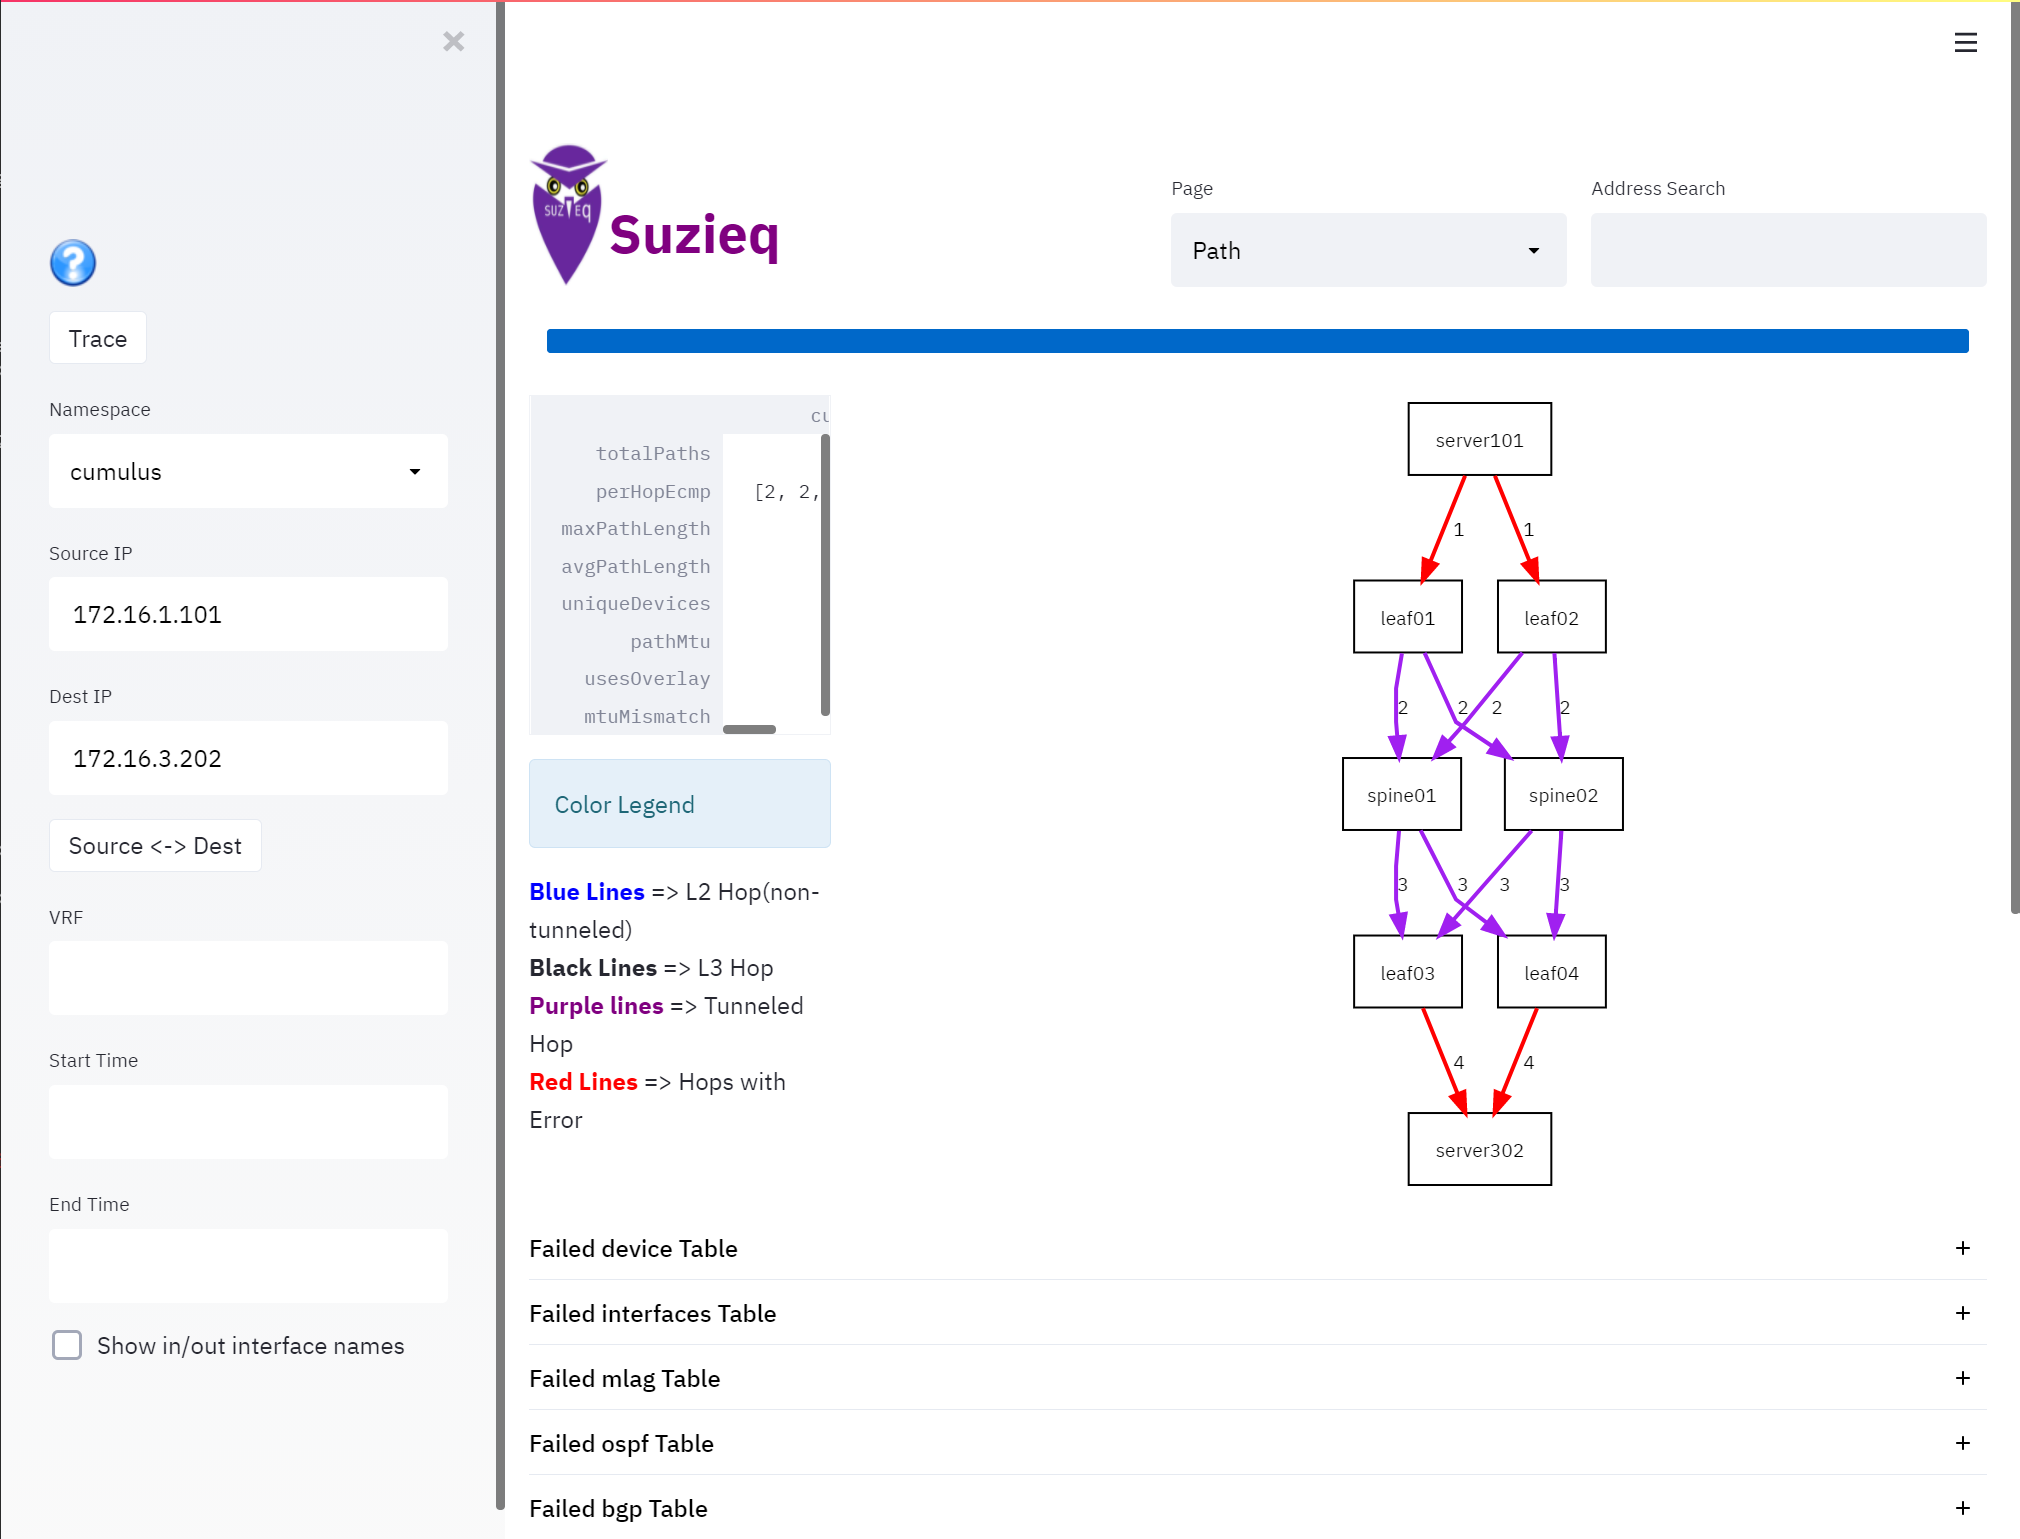
In version 0.8.5, we’ve added the ability to see how forwarding decisions are being made at each hop. For instance, on the above picture, if you would click on the leaf01 device, you can see it’s forwarding behavior. 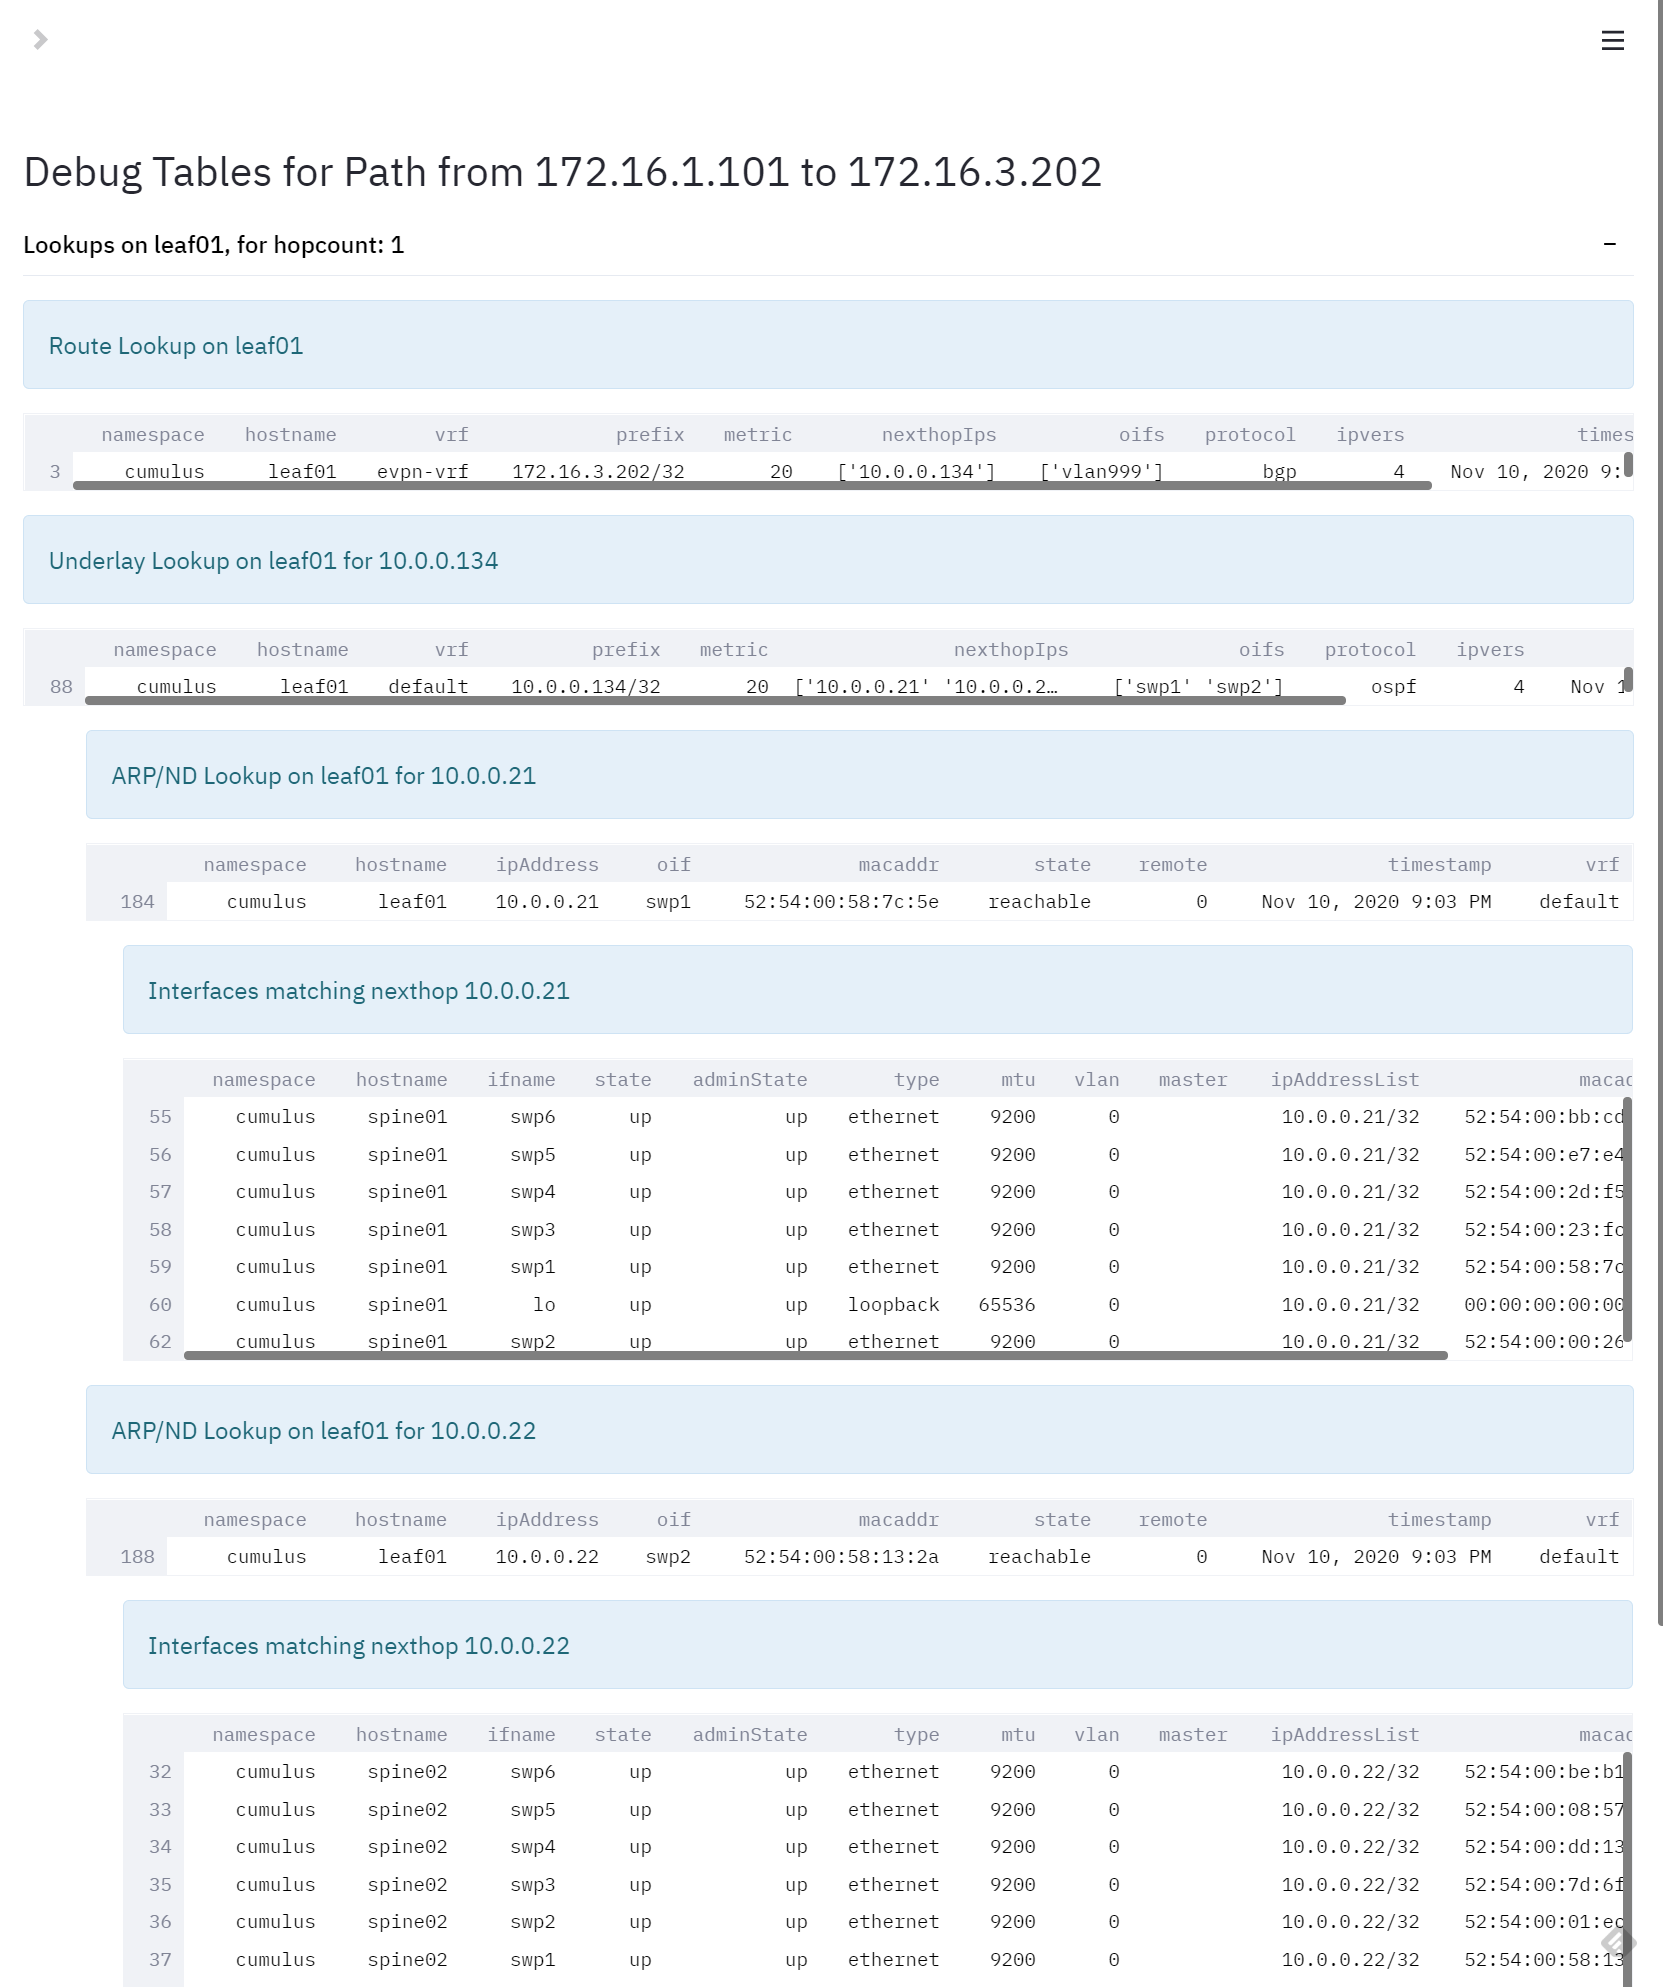
Search
One of the most common uses for Suzieq is to find things in the network, like MAC or IP address. While you can use the regular Xplore and pick the right table, we have a convenient search to look through any of those tables. It defaults to address table, but you can have it also search the routing table, the MAC address table and the ARP/ND table. 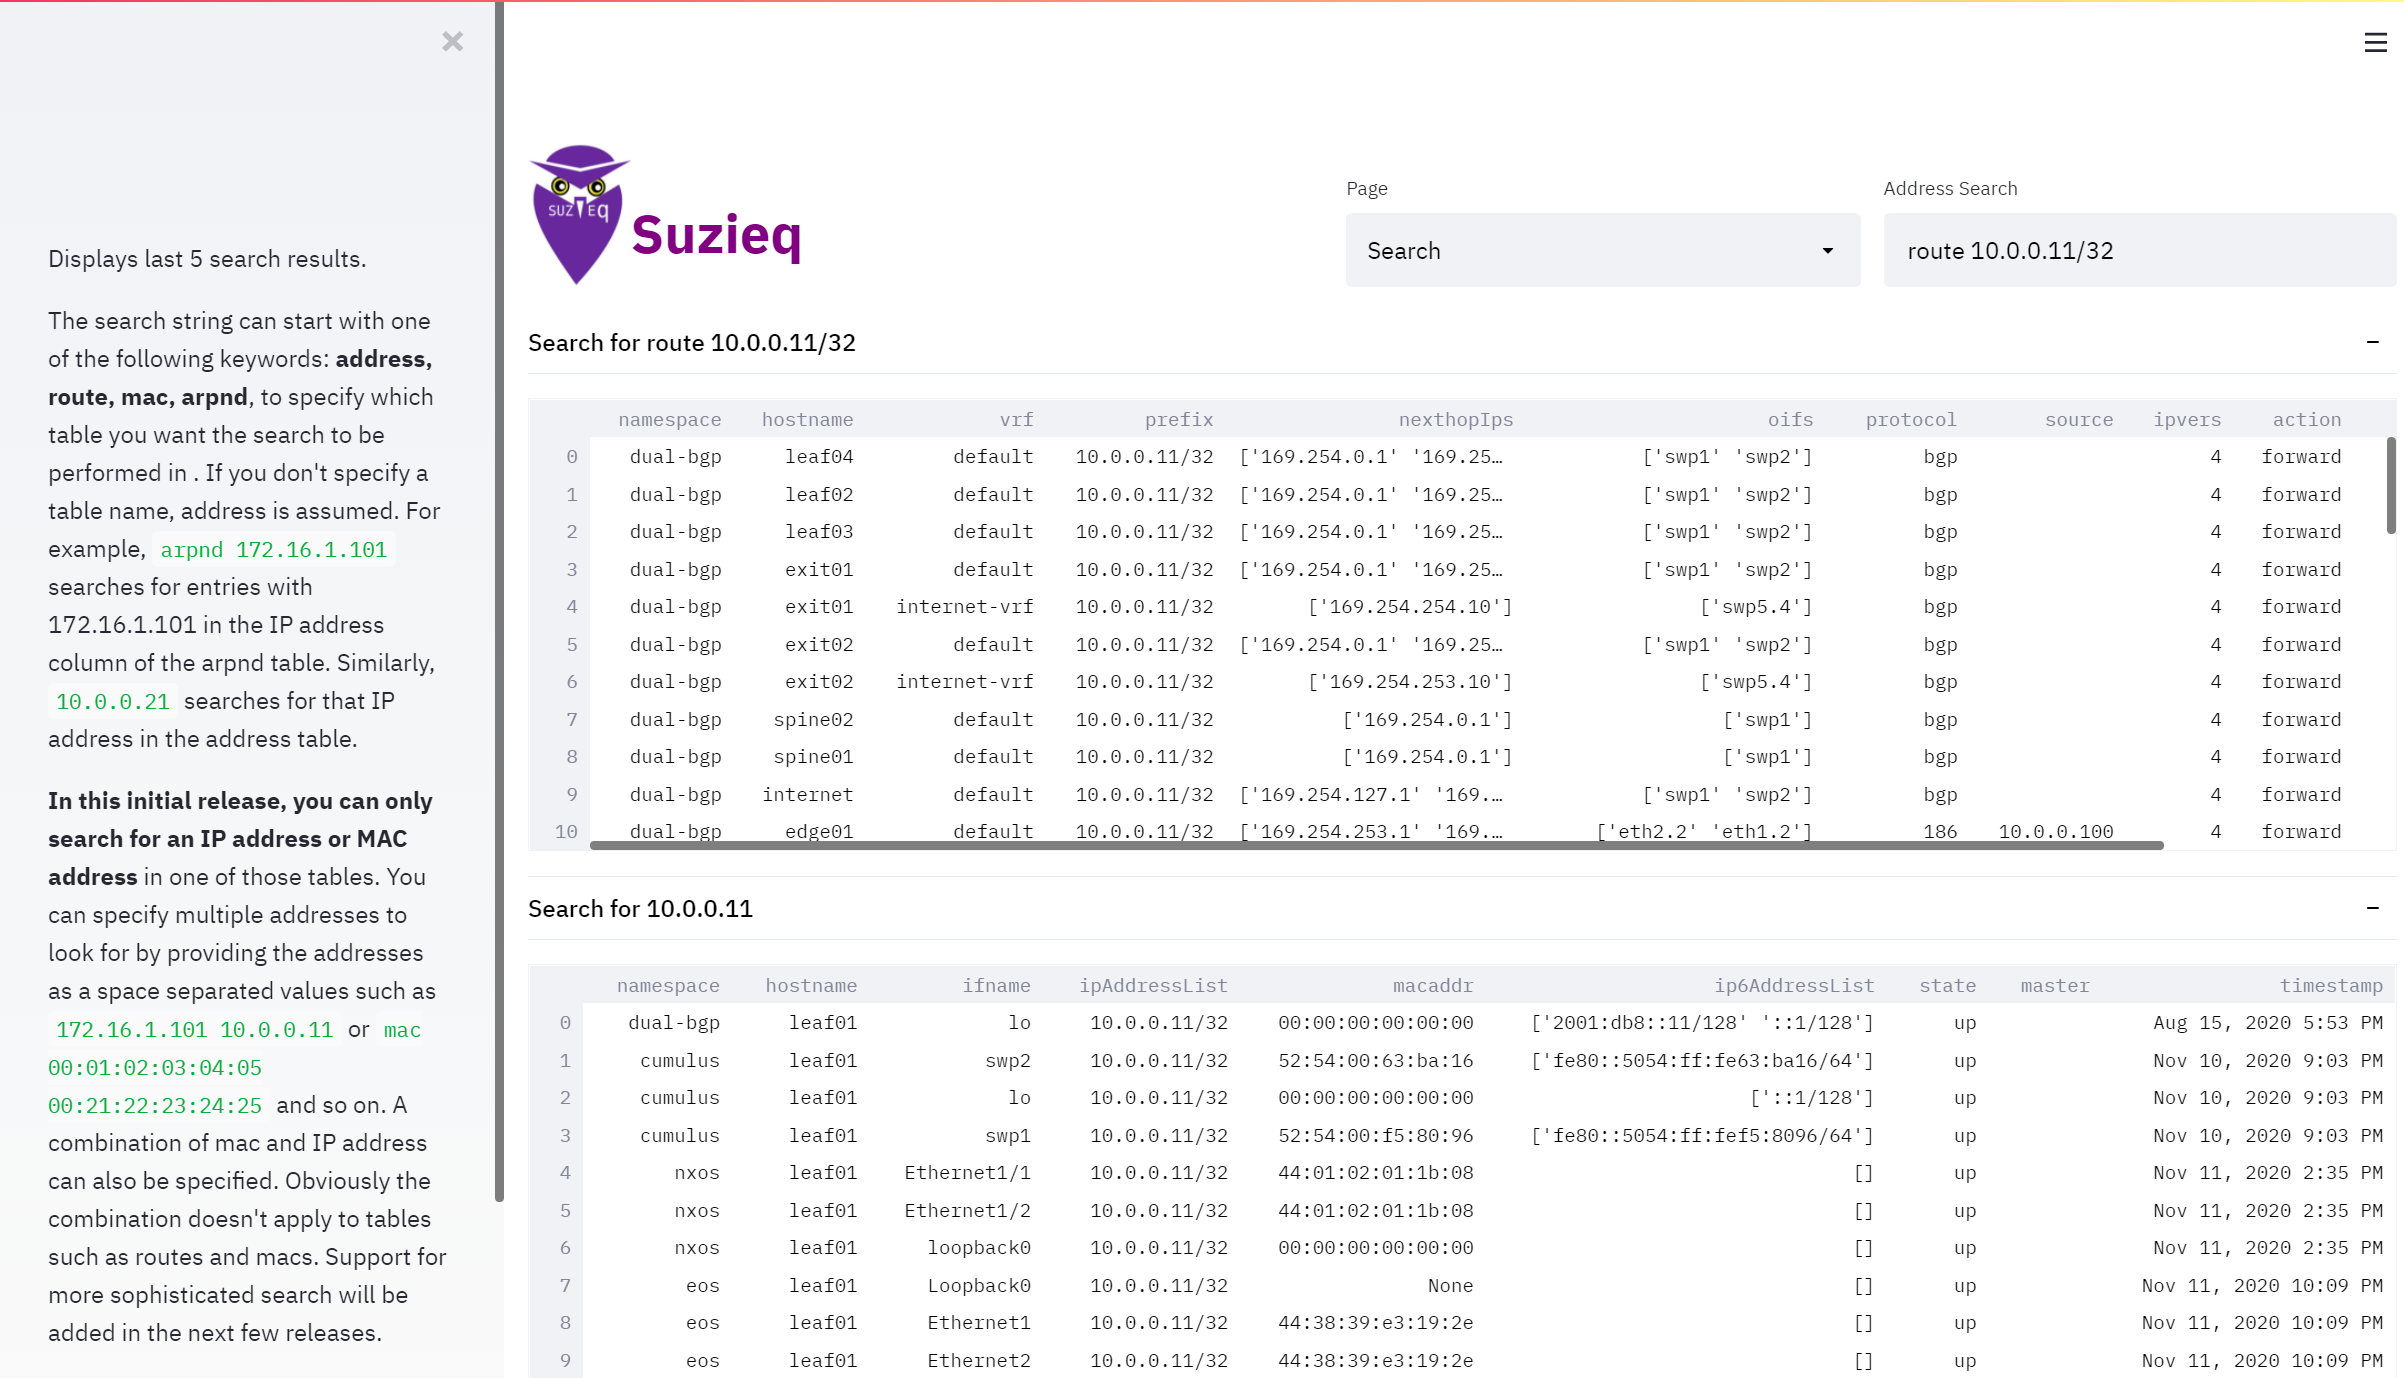
As you can see in that example, if you search for an ip address, it will get it from the address table. If you want to search a route, then type add route in the front and provide the prefix length.
Asserts
Another really powerful tool that Suzieq has are asserts. Asserts are statements that should be true; Suzieq can show the violations of those asserts. On this version of the GUI we’ve included the assert output on the same Xplore page for those services that have asserts. 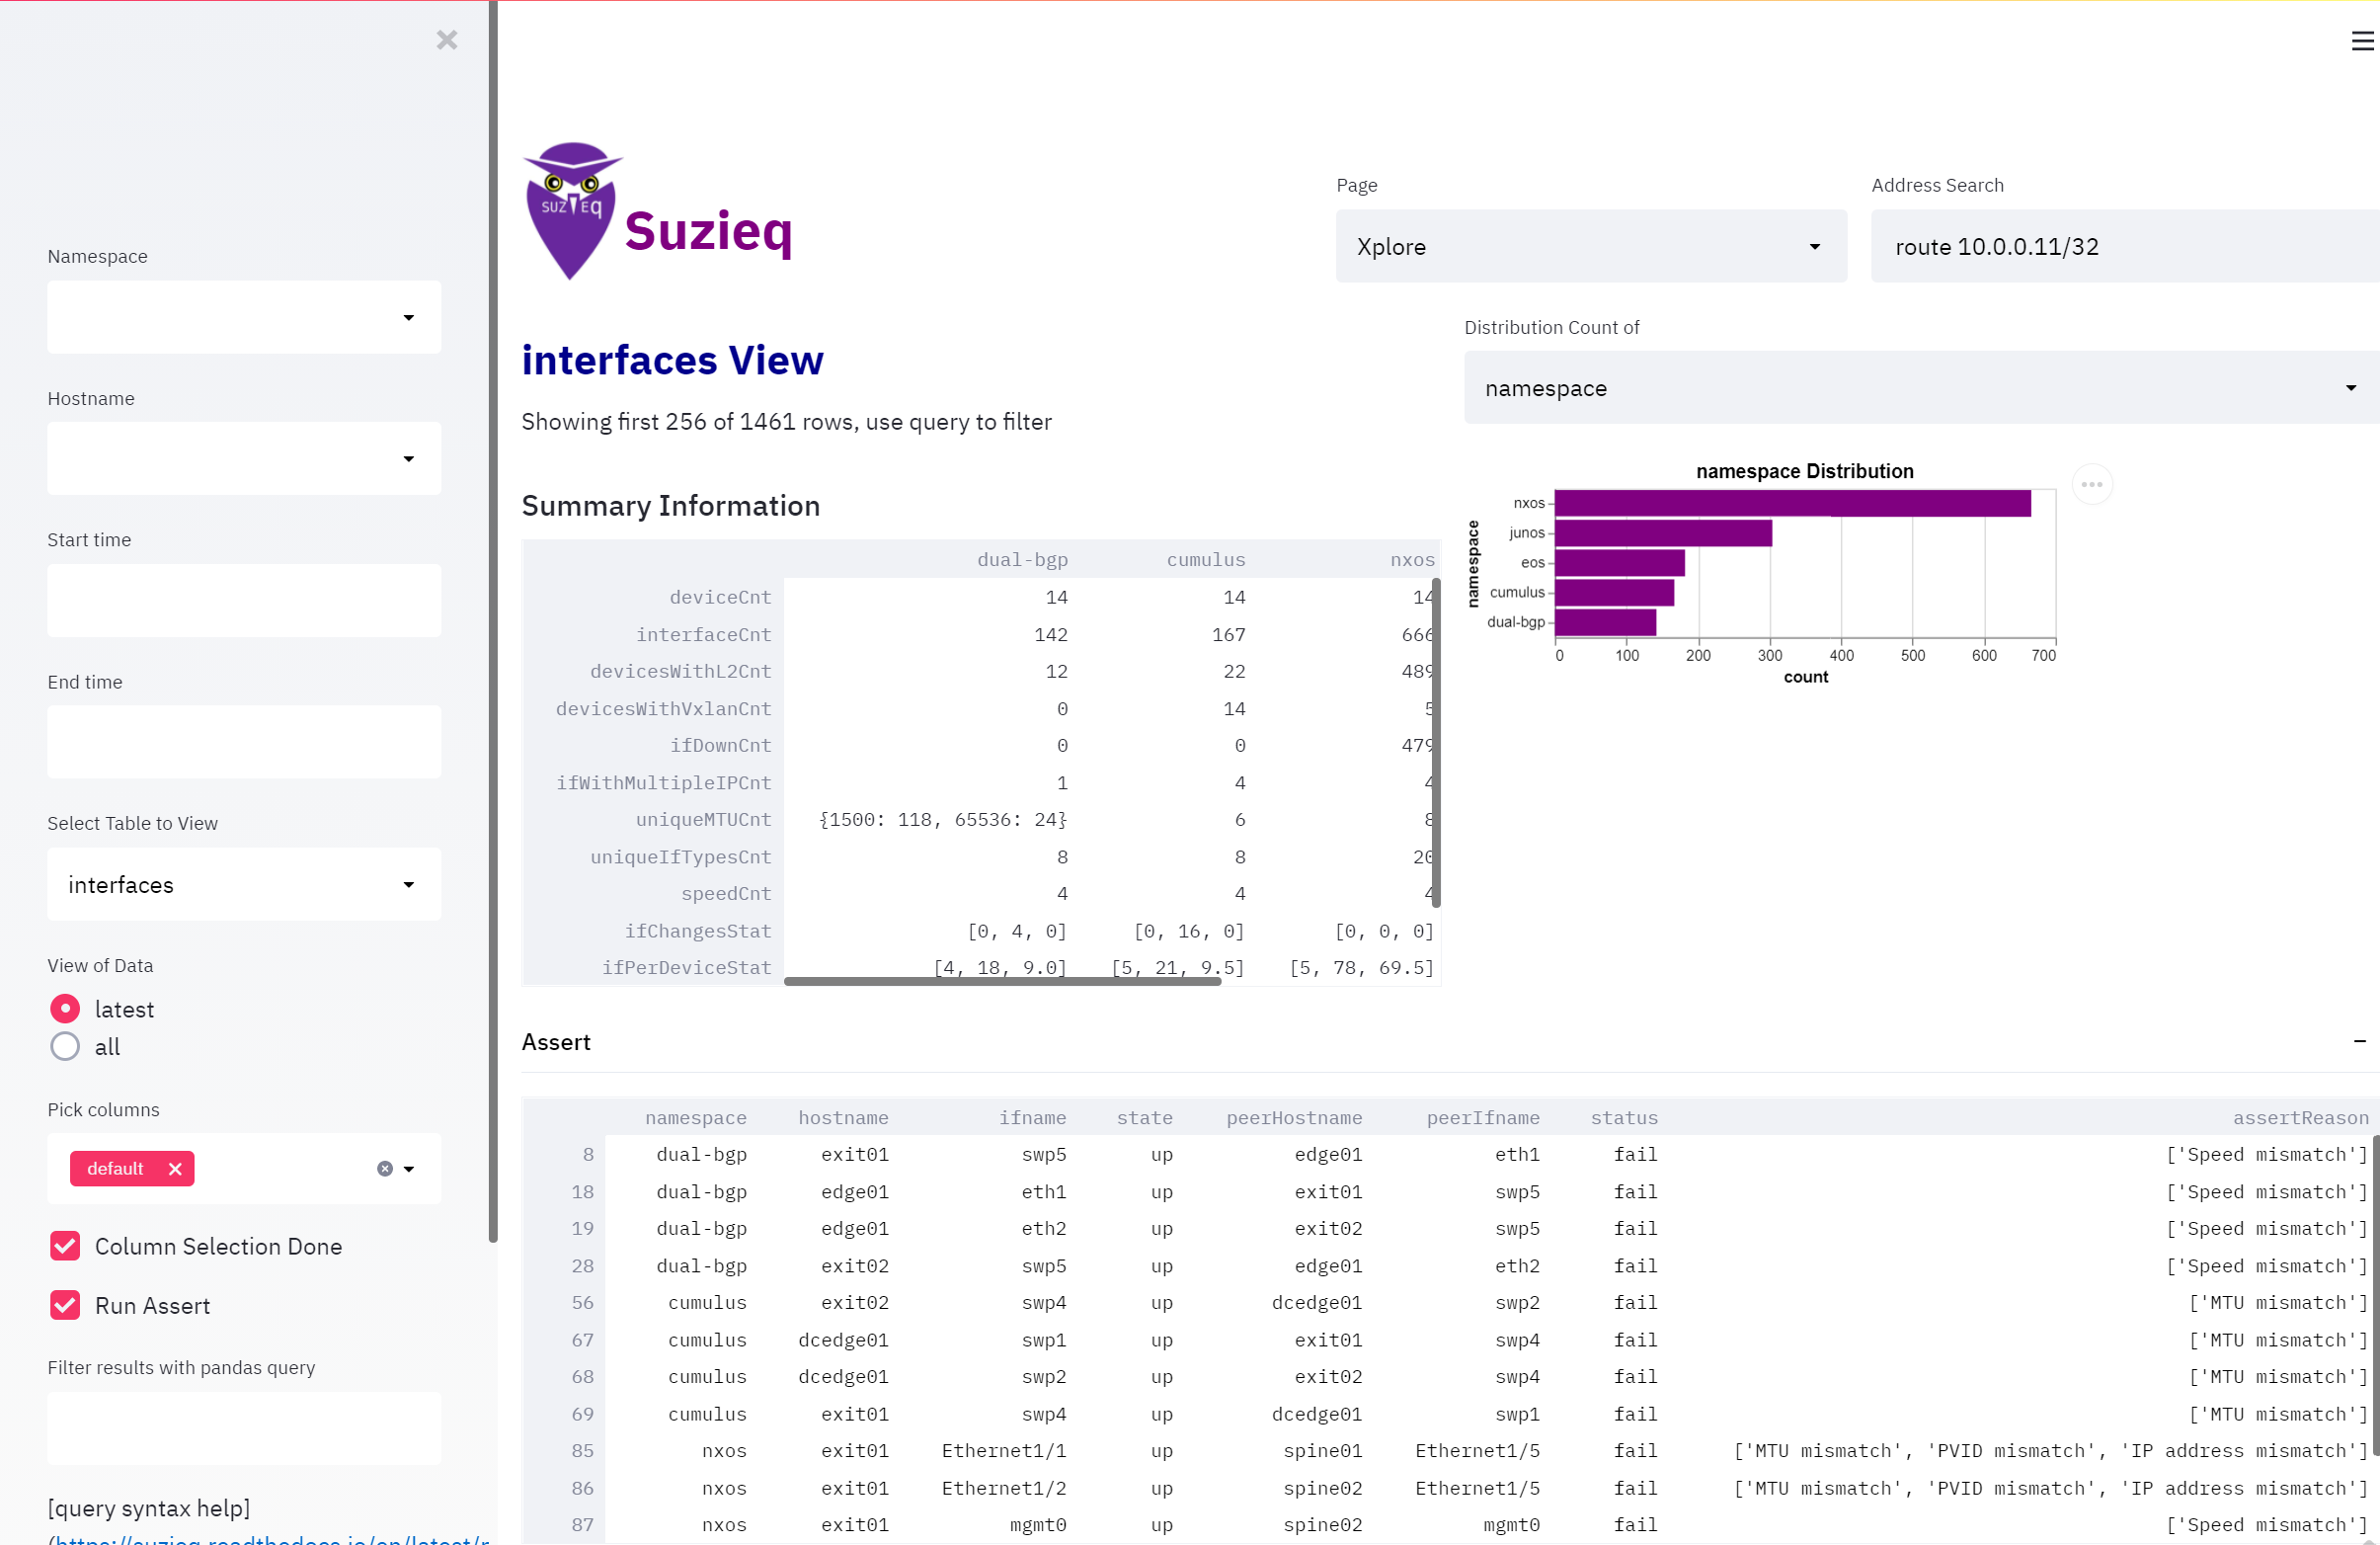
Where Suzieq is going
We still have so much more to build and demonstrate in Suzieq. We’d love it if you would like to contribute. Anything helps. Try it out, give us feedback, write some code, and help us build a great piece of important network software.
Try out Suzieq
As always, you can find Suzieq on Github.