- 2nd Post Followup Measuring BGP Stacks Performance
- 3rd Post Comparing Open Source BGP stacks with internet routes
- 4th Post Bird on Bird, Episode 4 of BGP Perf testing
- 5th Post BGP Performance 5 – 1000 full internet neighbors
- 6th Post BGP Performance testing with filtering
- 7th Post Performance testing of Commercial BGP
Open source BGP stacks are very important, but I don’t think they get the love they deserve. There’s lots going on in open source BGP stacks and I can’t keep up. So I thought I’d like to quantitatively compare them. This is one, often tiny, aspect of evaluating a BGP stack. I did fairly simple testing. Very little policy, just the number of routes and/or number of neighbors are the independent variables.
The stacks evaluated are BIRD, FRRouting, GoBGP. These have different sets of features, for instance both FRR and BIRD have more full routing stacks that include other protocols. BIRD and FRRouting are single process/core stacks while gobgp can use multiple cores. One of the reasons I did these tests is that I was hoping that we’d see the benefits of multiple cores.
Test setup
I started with bgperf, written by the same people that write GoBGP. bgperf hasn’t been updated in 4+ years, and pretty much doesn’t work at all. It doesn’t work with Python3 and doesn’t correctly configure any of the current versions of these protocol stacks. I’ve forked and updated bgperf to work with current software, at least for the tests I ran. bgperf has quite a bit of complexity that I didn’t try out, especially around remote test subjects.
bgperf uses ExaBGP to source and send all the routes. In some of the tests, ExaBGP adds a lot of load to the test because it’s not the most efficient code (written in Python). However, I think you can see what this means by comparing the same test for the three different stacks. The way that bgperf works is that it creates all the configuration needed for the tester, the stack under test, and the observer. If you have more than one “neighbor”, that means it’s more than one ExaBGP process.
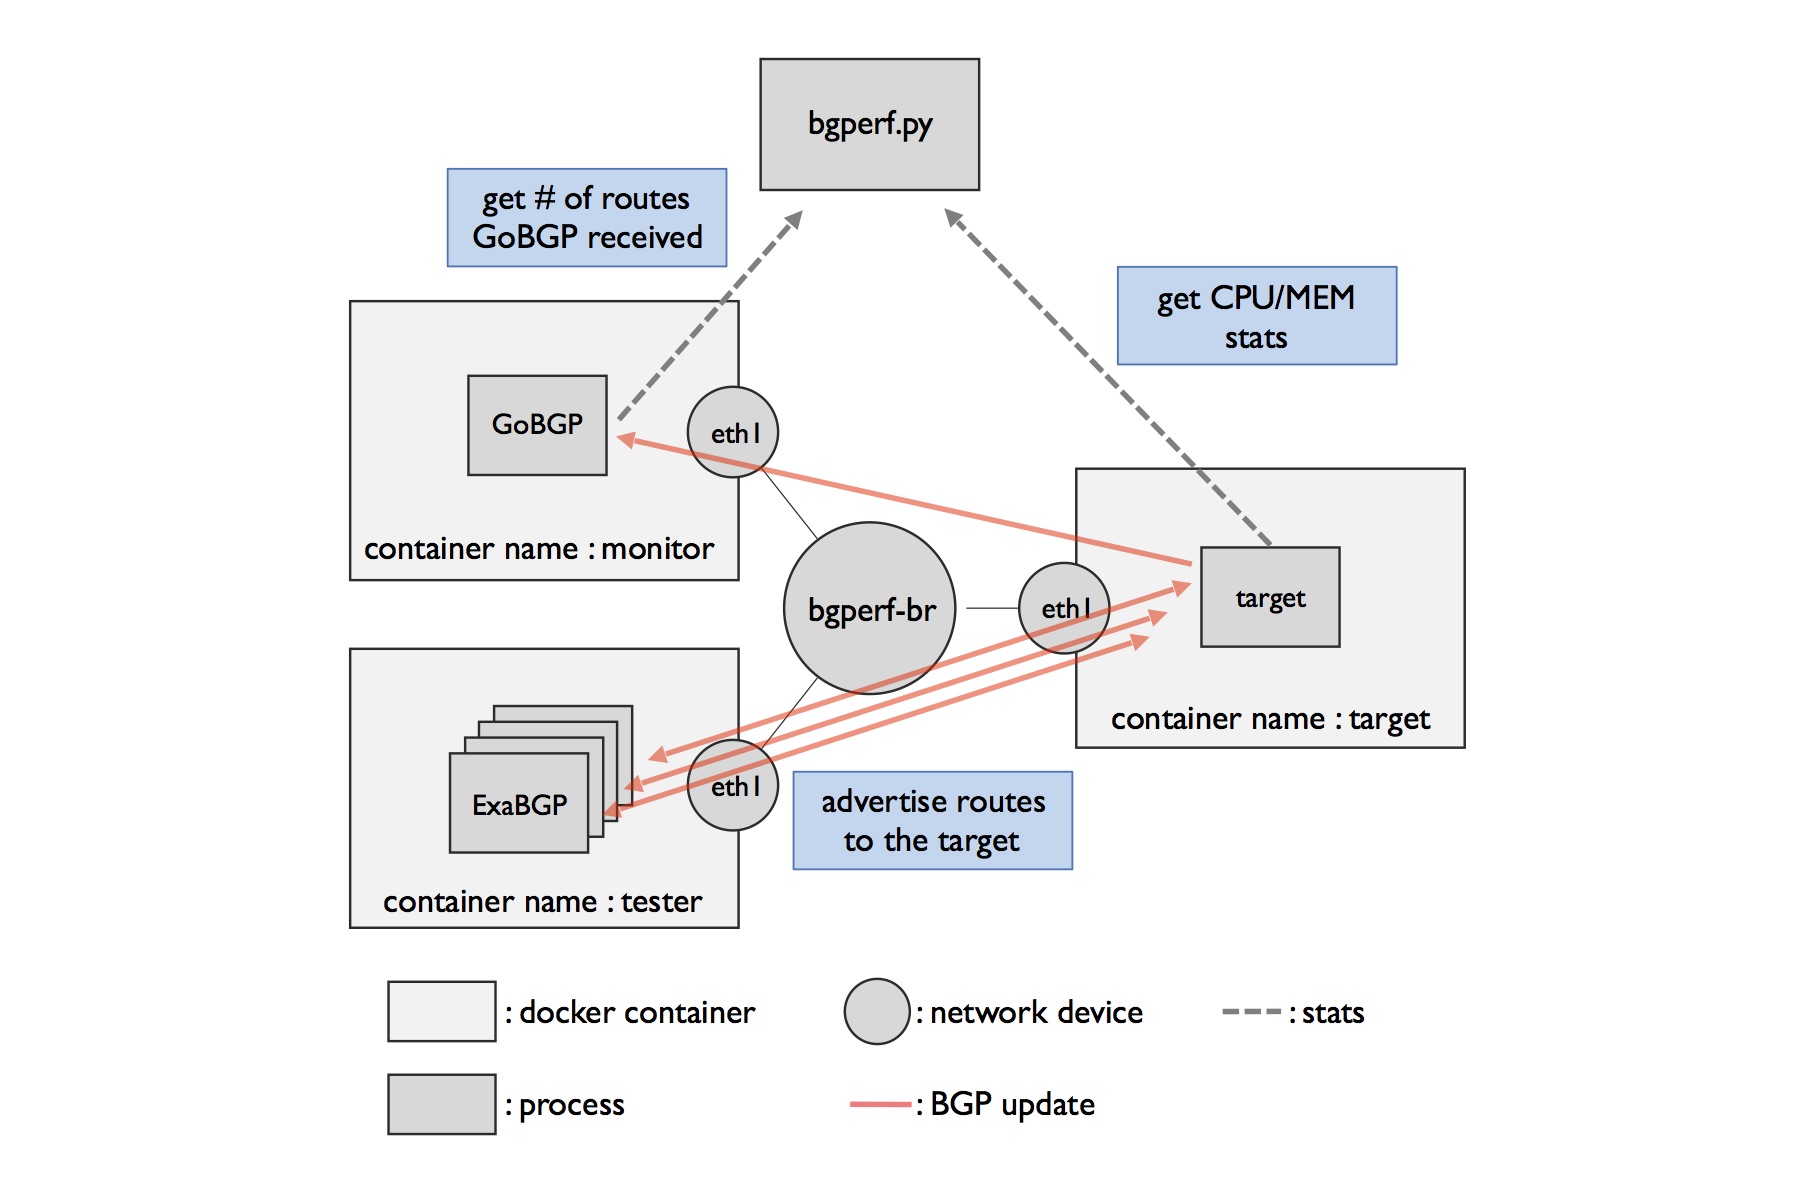
One thing specific for BIRD; for reasons I don’t understand, bgperf by default creates a separate routing table for every neighbor. I’m not sure when you want to use that and when you do not. If you pass it the -s flag then you get one big table. bgperf doesn’t do this for they other stacks. This has relevance to performance when there are a lot of neighbors which I’ll show in some of the results.
What do these results mean?
There are lots of things that are going on that we have to measure. We have to measure how long it takes for ExaBGP to get started, the time the test stack takes to initiate all the neighbor connections, and then the time it takes to pass all the routes.
Let’s look through some examples. My tests are primarily done on my 16 core AMD 3970 with 64 GB of RAM. I did some tests also on an EC2 m6g.16xlarge.
10 neighbors 10K routes
Let’s start someplace simple, 10 (ExaBGP), each advertising 10K routes. Let me explain what all those numbers mean.
Total Time is the time measured from unix time command for the whole duration and the process: starting everything up, connecting everything, sending traffic, monitoring. Next is the neighbor time, which is the time it takes for all the neighbors to get connected to the test stack. After that happens, the bgperf measured the time it takes to send and receive all the routes, which is elapsed time. You can also see the time that elapsed since the first route, which tells us how much time it takes ExaBGP to get working and sending traffic. In other words in this case of 10K routes, it takes ExaBGP about 1 second before it sends the first route.
This test isn’t much of a stressor on these stacks so we don’t see much differentiation. In this case, they all take 1-3 seconds for the test. GoBGP takes longer to establish neighbors and it uses a lot (1160 vs 10-20) more CPU.
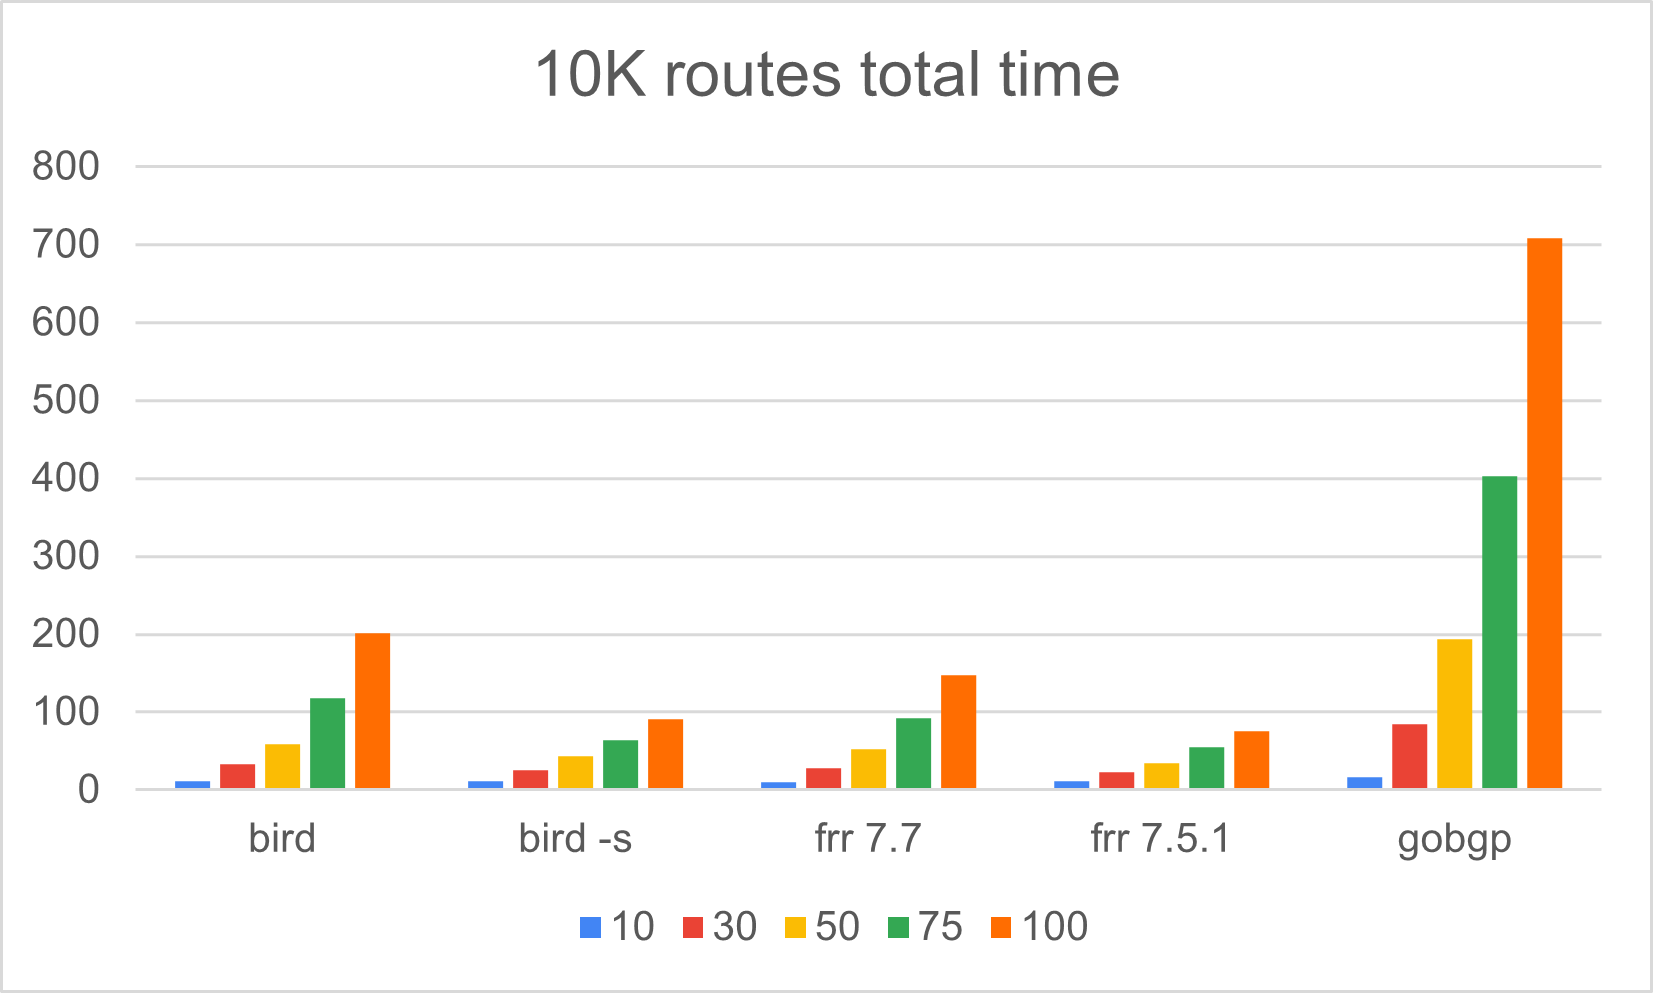
100 neighbors 10K routes
This might not be usual, but I’d bet there are some places where it’s critical to have 100 neighbors on a single devices.
You’ll notice that there are two BIRD results here: the faster results are the single table results (with the -s flag to bgperf), while the longer are a table per neighbor. Single table is about 10x faster in this test 14 seconds vs 139. Also single table uses 1.4GB vs 10.6GB of memory. That makes sense.
Single table BIRD and FRRouting each take about 15 seconds to send all the routes. However, FRRouting takes 61 seconds vs 4 to create all the neighbor relationships, so the total time for the whole test is much longer. It turns out that the version of FRRouting I originally used was not a stable version. Moving to version 7.5.1 got times faster than BIRD.
GoBGP starts really looking bad here, about 40x slower than FRRouting or BIRD
10K routes
All those 10K results in 1 graph.
5 neighbors, 100K routes
What happens if we add more routes? Let’s go up to 100K routes, staying with the 10 neighbors.
BIRD and FRR have similar performance. GoBGP is starting to get a lot slower. It’s taking 24 seconds to receive all routes, while the others take 3-4 seconds. BIRD and FRRrouting take a full core at max CPU, while gobgp takes all the cores. GobGP also uses about 2x more memory. Not looking that great for gobgp.
5 neighbors, 1M routes
Again, BIRD and FRR are similar in performance, with BIRD being about 25% faster, and GoBGP in this case is about 3x slower and 2x memory.
1 neighbor, 10M routes
I wanted to test something crazy, but it failed. The bgperf process runs out of memory creating configs before it even gets stared. bgperf creates all the config in memory before writing it out, so if you have a large number of routes, like 10M, it will run out of memory on the 32bit Python process before it even gets to any of the rest of the test. This clearly could be improved, but I didn’t get that far.
500 neighbors
FRRouting gets really upset when there are 500 neighbors, and it takes over 30 minutes to connect all the neighbors. As mentioned above, FRRouting version 7.5.1 looks really good, but the original version I tested which is not a stable release has some issues
Observations
GoBGP resource utilization
I was assuming that GoBGP would use more CPU resources but be quite a bit faster on fast hardware. It turns out it just uses a lot of CPU resources and is a lot slower. I was really hoping it would take advantage of the hardware available.
FRRouting and lots of neighbors
The original tests showed very high neighbor times for FRRouting 7.7. I was trying to use the easiest way to build an FRRouting container, and didn’t realize I was using a dev version. It turns out that the last stable version 7.5.1 has very good neighbor times.
As mentioned, it turns out that this is an issue with the original version I tested, 7.7, and looks good with 7.5.1.
The problem was debugged from me on the FRRouting slack. Thanks People!
Bird table per neighbor
As mentioned, bgperf by default has BIRD use a separate table per neighbor. When there are lots of neighbors, this is much slower and uses more memory, as expected.
Conclusion / Followup
FRRouting and BIRD (single table) are pretty close in performance. The 7.7.1-dev version I originally tested was slower, but that was a dev version and I didn’t understand that. It looks like FRRrouting 7.5.1 is in general faster than BIRD, but I wouldn’t assume that’s actually true in practice. There might be interactions with ExaBGP testers that affect performance when the differences are that small. More for me to understand. Also, of course, this is pretty simple testing, so there are certain to be other features of BGP that will have different performance characteristics that might affect you more.
I’d sure love it if you want to have a discussion about how to have better tests. If you propose a test, I’d love config snippets for the protocol stacks that show exactly what you want to compare. Or even better, PRs to bgperf.
There is more to learn even from the results I’ve collected at the end.
Anybody have any other benchmarks that are useful?
Keep me honest if I did something dumb!
Next steps
Need to test more sophisticated policy. I should probably also see if this gobgp vs quagga with prefix lists, slide 15 is still relevant, that Quagga/FRR doesn’t scale with the number of policy lines.
I’m curious to test rustybgp, and bio-rd, and whatever else there is.
I should get the remote bgperf working and try out VM or container for various commercial stacks.
Update 2021-07-27
-
fixed typos in the tables
-
removed the debugging section and put it into the bgperf README
-
In cleaning up bgperf, I made it so that it used the FRRouting container in docker hub that is the latest. It turns out that’s not a stable version and has some issues in neighbor performance. I then hard coded to the latest stable version (7.5.1) and reran tests. I’ve included that data above.
Update 2021-07-30
- tried to make it more clear the results and that the original testing of FRRouting was for a dev version, not a production version.