- 1st Post Comparing Open Source BGP Stacks
- 2nd Post Follow-up Measuring BGP Stacks Performance
- 3rd Post Comparing Open Source BGP stacks with internet routes
- 4th Post Bird on Bird, Episode 4 of BGP Perf testing
- 6th Post BGP Performance testing with filtering
- 7th Post Performance testing of Commercial BGP
In the 3rd post I compared these open source BGP stacks with up to 50 neighbors that had full internet stacks. What happens if we try to get 1000 Neighbors with full internet routes? Is that realistic? I don’t know, I don’t have direct knowledge that anybody needs this. It’s not important for most people using BGP stacks of any sort, but it’s probably interesting so somebody. I have heard of people with 1M L3VPN prefixes that want hundreds of neighbors. I was asked if it’s possible to test 1000 neighbors. I don’t have a good way to test 1M L3VPN prefixes right now (I think all I’d need is an MRT file with that data, but I don’t have that now.) So for now the best I can do is to do the same testing I’ve done in the last two posts, but make it a lot more neighbors. It won’t be the same exactly, but it should be representative.
I had not thought this sort of testing would be useful because of the unlikeliness of needing 100s of neighbors with full internet table but then I started running experiments and found that I could break the stacks in interesting ways so I figured I should write up a blog post.
Test setup
A major question is if it’s reasonable to be able to test 1000 neighbors with full internet tables (800K prefixes). I wasn’t sure, but bgperf has support for playing back mrt files using bgpdump2 which is very efficient. As always in these blog posts, I’m testing multiple things. The first is if bgperf on the hardware I have available can usefully perform this test. The second is how well these stacks do with this many prefixes and neighbors. For the first I’m using different hardware: home computer with 64 GB RAM, EC2 M5.24xlarge 24 with 96 cores and 384 GB RAM, and EC2 M5z with 48 cores and 192 GB RAM. I want to be able to take advantage of the cheapest hardware available for any test. It turns out the most important thing is not running out of memory.
Comparing stacks
The baseline is 100 neighbors with 800K prefixes each.
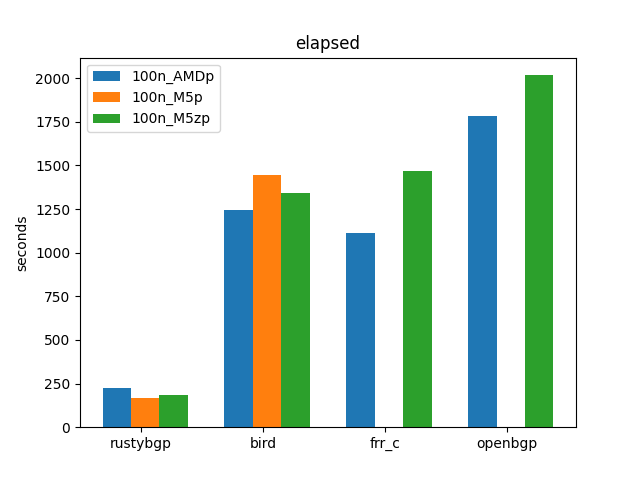
I didn’t do complete testing for FRRouting and OpenBGPD because I think you can see the general trends.
These results show several things. Each of these 3 hardware platforms performed fine. For BIRD, the AMD is the fastest, then the M5z, then the M5, but not by that much. That makes sense, home CPU have higher frequency single core, , then the M5z, then the M5. I assume FRRouting and OpenBGPD would look the same if I had run all the tests. For RustyBGP, it’s the reverse, which is what we’d hope since it can take advantage of more cores. Either way, the difference in CPU doesn’t matter very much in the performance. As we will see, the more important thing is the amount of memory needed to run some of the tests.
Let’s look at the performance of the stacks. All four stacks can all handle this load. Second, RustyBGP is > 5 times faster. That’s pretty amazing. FRRouting is a little bit faster than BIRD, and OpenBGPD is the slowest.
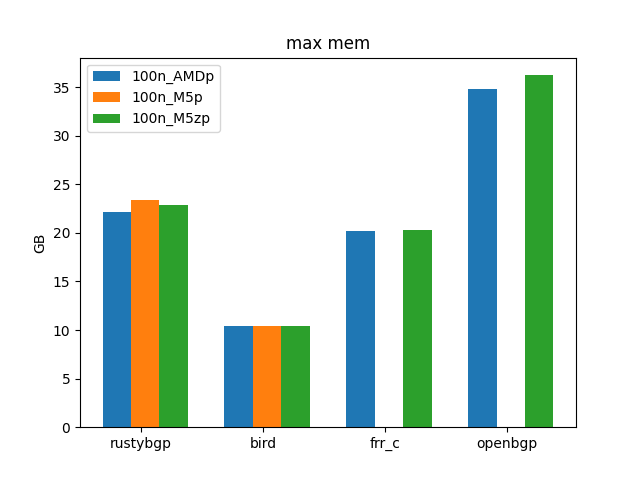
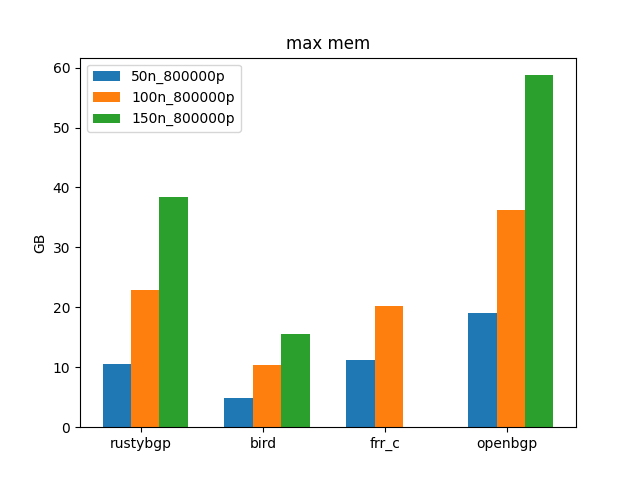
OpenBGPD still uses the most memory as we’ve discussed in the past.
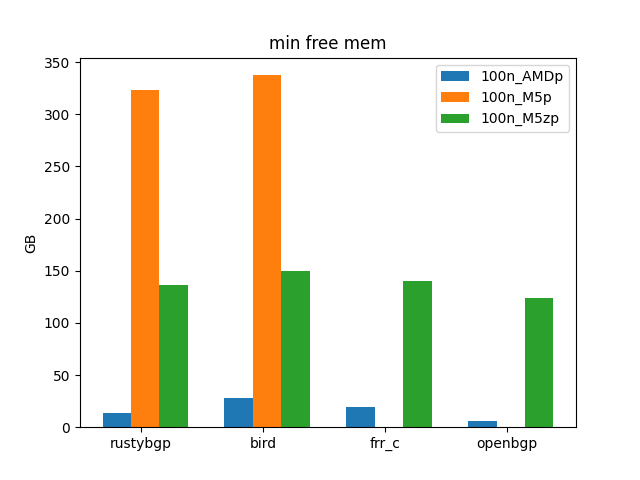
As long as it doesn’t run out of memory, each of these host platforms can do reasonable tests. I tried FRRouting at 200 neighbors and the AMD ran out of memory.
On the M5z
Let’s see how each of these scales as they go from 50 to 200 neighbors.
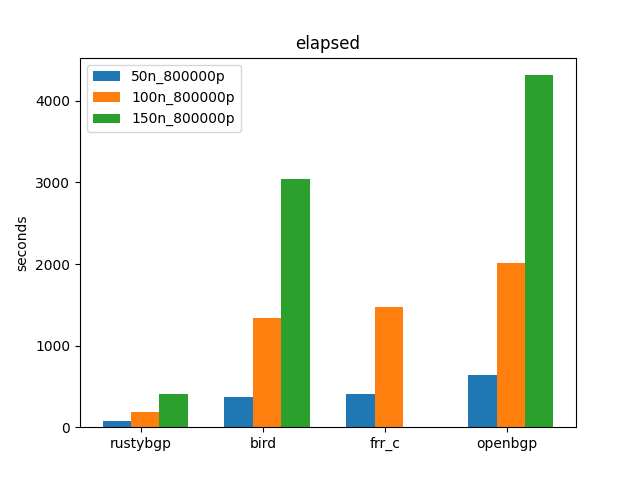
On these tests, BIRD and FRR are about the same, thought FRR cannot finish the 150 neighbor test, as discussed below. OpenBGPD is the slowest. RustyBGP is the fastest by a lot. None of them scale linearly, which is interesting, at least from 100 to 150.
Detailed Baseline Graphs on the M5z
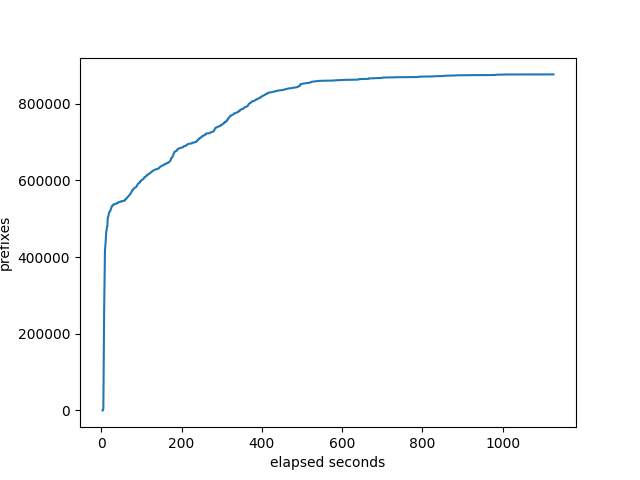
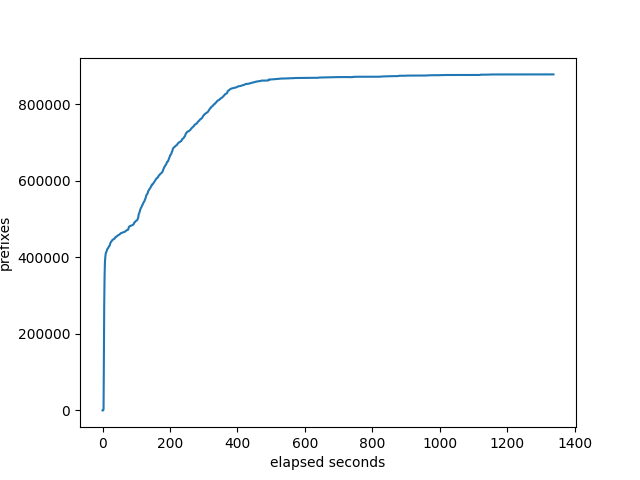
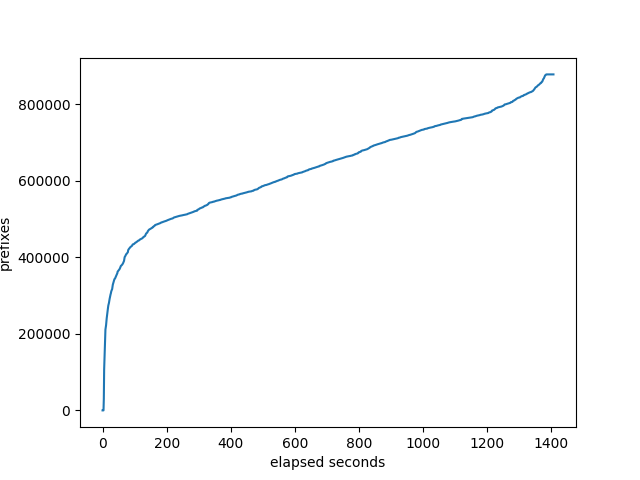
I’ve added some graphs to show how things go over time with any give test. For each individual test, bgperf now produces graphs. I’m not sure of the use of these graphs, but we’ll try them out here.
Prefixes received at the monitor
FRRouting
BIRD
OpenBGPD
RustyBGP
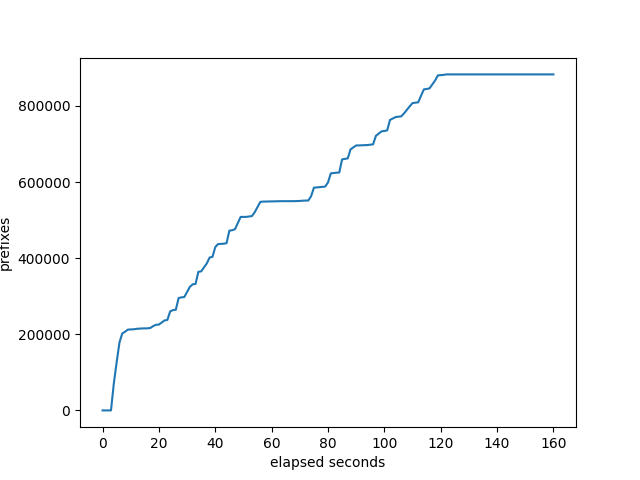
RustyBGP curve looks a lot different. Don’t know why. On the other hand, RustyBGP completes in 160 seconds, while OpenBGPD completes in 1407s, almost 9 times faster.
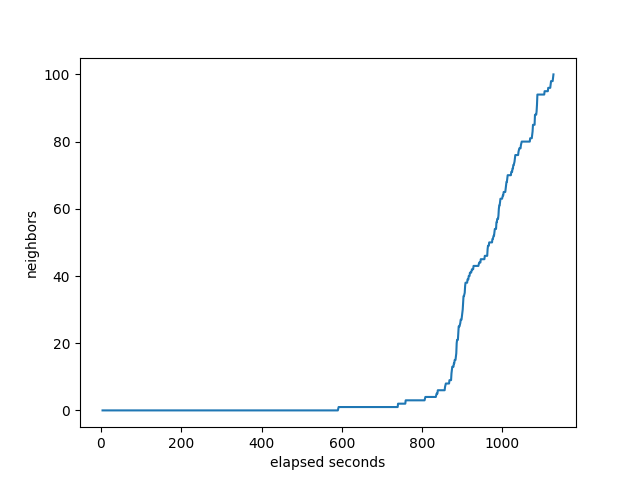
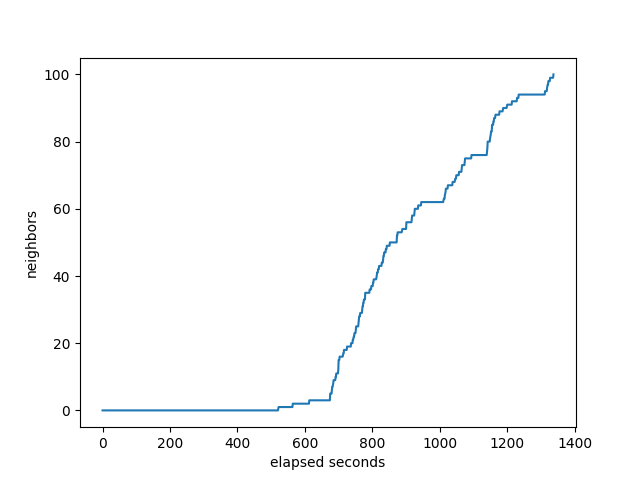
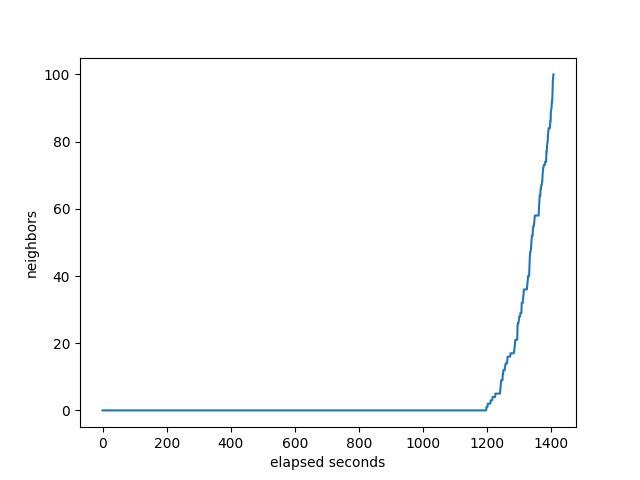
Neighbors that have sent the full table
FRRouting
BIRD
OpenBGPD
RusytBGP
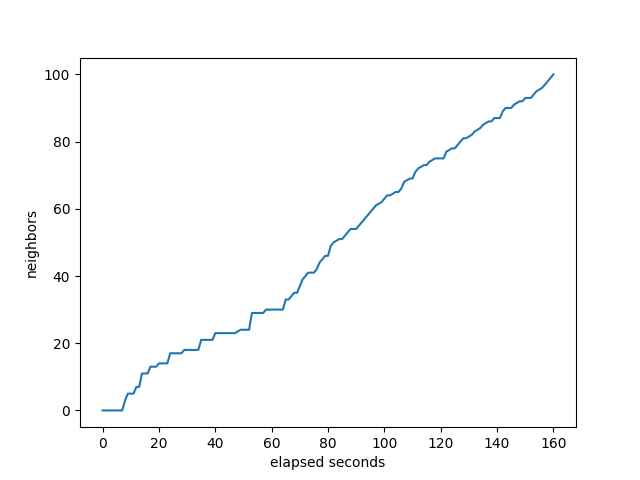
It’s interesting how OpenBGP looks compared to BIRD and FRR. None of it’s neighbors complete until almost at the end, while FRRouting and BIRD start completing much sooner. While the others show either neighbors completing before the monitor gets to 800K, or the monitor gets to 800K before the neighbors, OpenBGPD has them pretty close to in sync.
RustyBGP looks different again. It’s amazing that it can receive full routes for some neighbors within about 10 seconds.
Target CPU Utilization
FRR
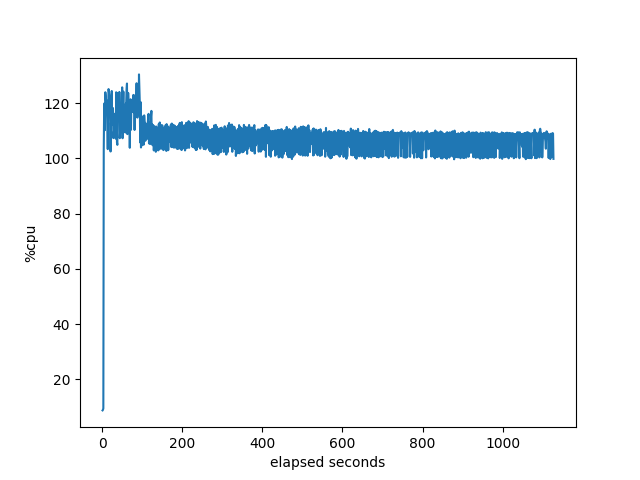
BIRD
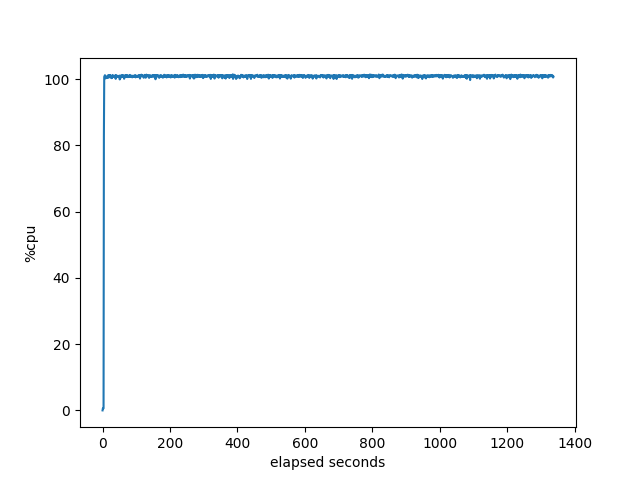
OpenBGPD
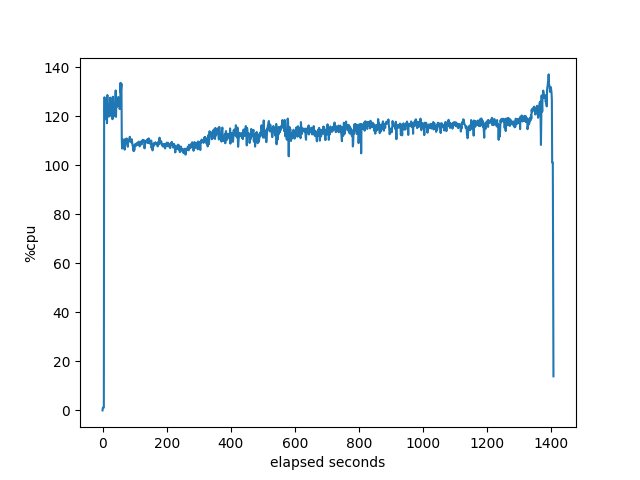
RustyBGP
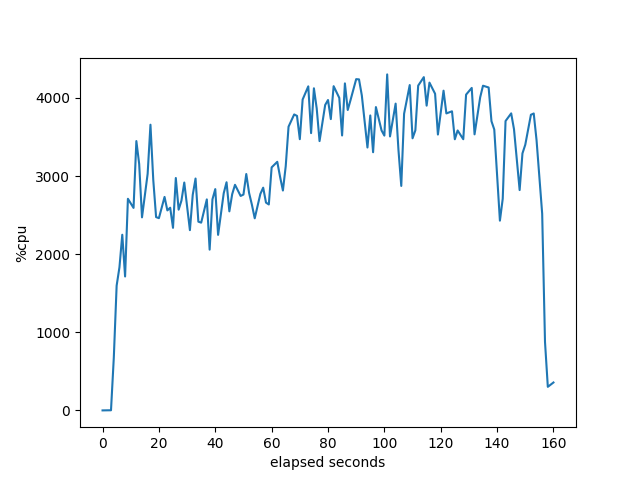
These are pretty much as expected since the first three can only take advantage of the single core. Not sure what RustyBGP does at about 60 seconds that makes the utilization go up even more. Oh, wait, if we look below at the memory allocation, that lines up with when RustyBGP dramatically slows down it’s allocation of memory. Oh, if we look at the percent idle, that’s also when all the bgpdump2s are finished launching. Interesting. I’m not sure what it means, but there is some correlation there.
Memory used by target process
FRR
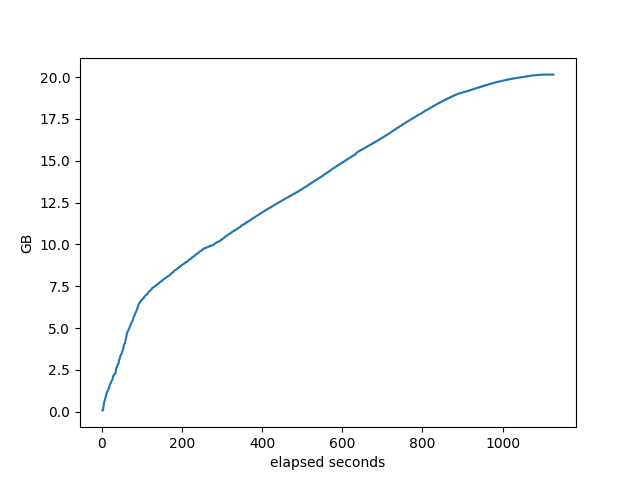
BIRD
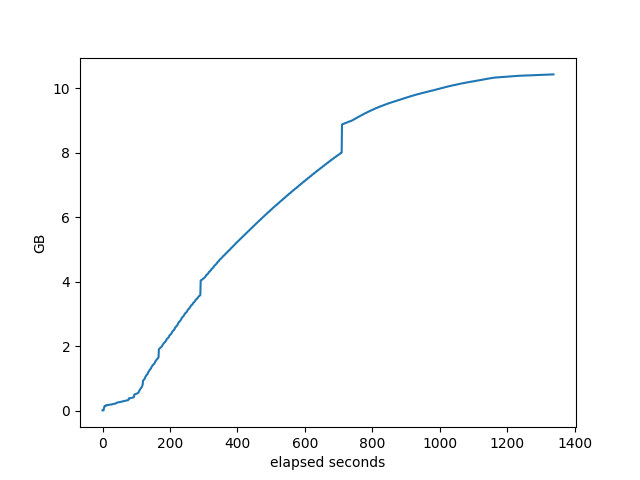
OpenBGPD
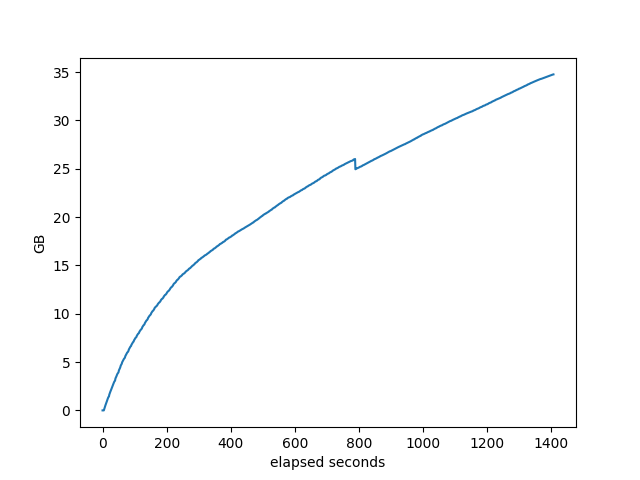
RustyBGP
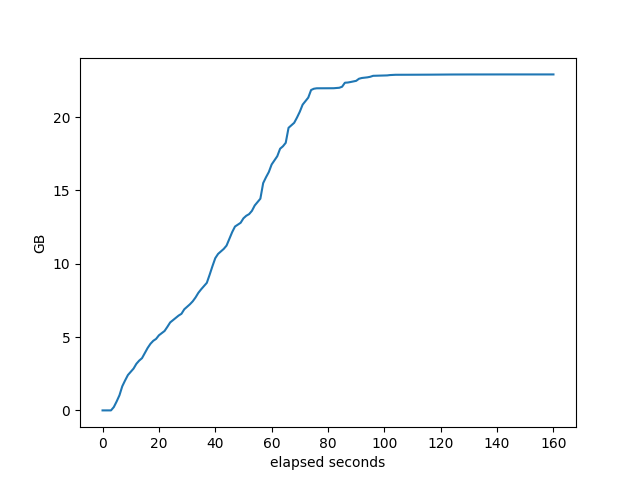
Each of those looks different, don’t know what it means, especially in comparing between the stacks. They do allocate differently.
% idle of the machine.
FRR
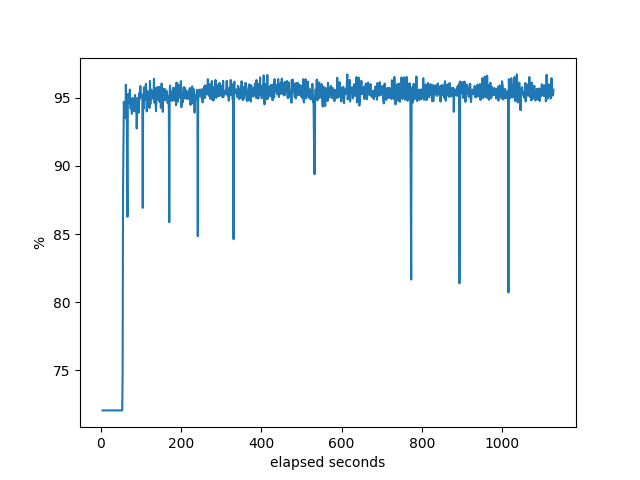
BIRD
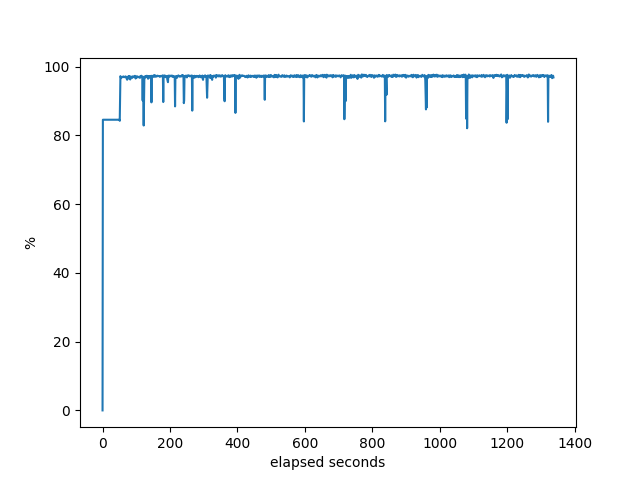
OpenBGPD
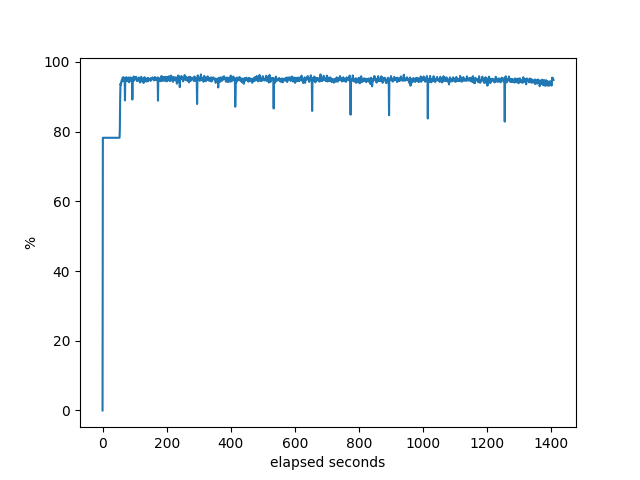
RustyBGP
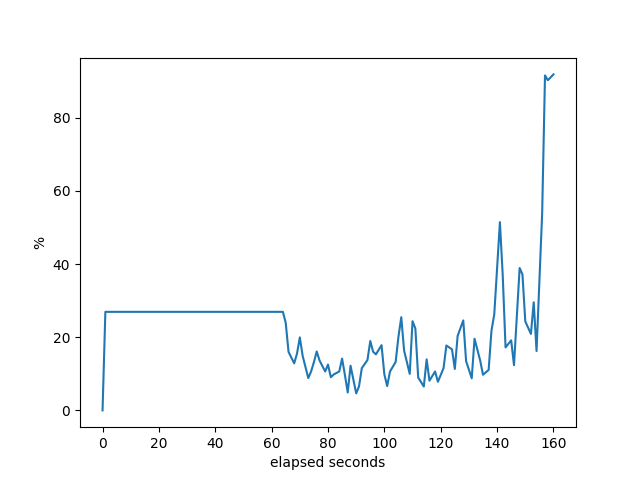
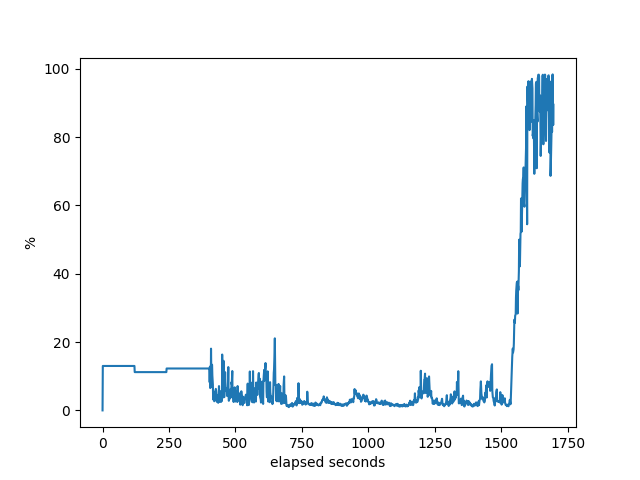
Some things to explain here. Notice the flat line at the beginning of each of these. That’s a consequence of the way that bgperf is currently monitoring the host information. So we only have the last data point right before all the testers (bgpdump2) are fully running. It’s a bug in the tester. Anyway, it does show, though, that when bgpdump first starts up it uses a lot of CPU resources, but after initial loading it barely uses anything. Even on the host with the least resources (AMD), there is plenty of CPU available on the host for the majority of the test. Except for RustyBGP, which uses most of the CPU.
1000 neighbors ?
FRR
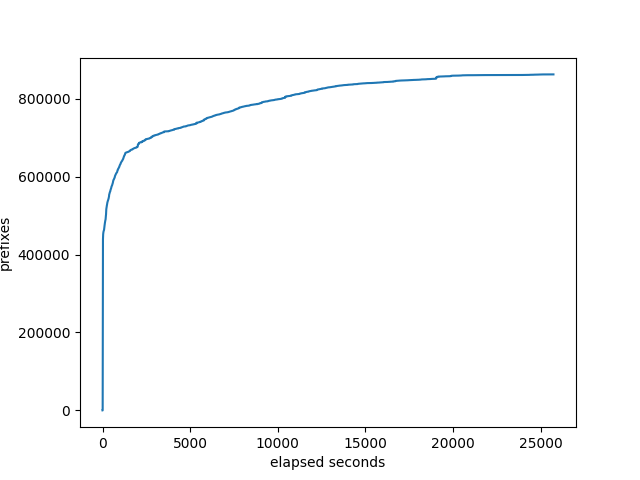
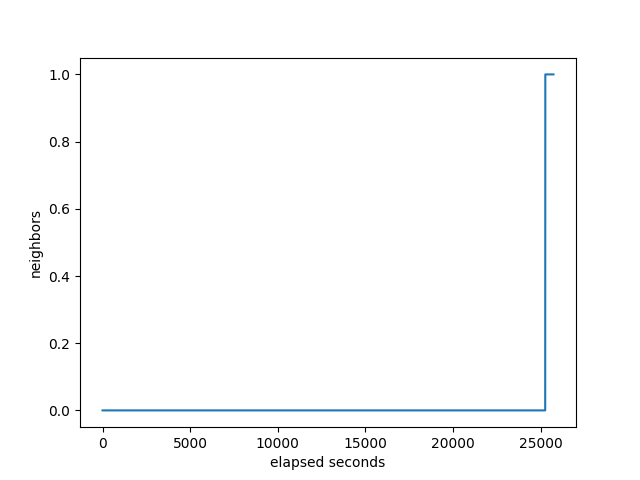
At 150 neighbors, FRRouting does not finish ever. Several problems. Some of the neighbors never send any prefixes successfully and the total prefixes received by the monitor doesn’t seem to ever get to the amount required. I ran one test for over 6 hours and it never finished.
If we look at the target we can see the total number of connections:
$docker exec bgperf_frrouting_compiled_target vtysh -c 'sh ip bgp summ'|awk '{print $10}'|egrep -v '^$'|grep -v 'State'|wc
    152     152     985
152 is the right number. It’s 150 testers + the monitor + BIRD shows a Kernel neighbor which we don’t care about.
But the interesting thing is that even hundreds of seconds into the test, many of the neighbors have still not sent prefixes successfully. Active state means the neighbor relationship is up and active, up there are no received prefixes
$ docker exec bgperf_frrouting_compiled_target vtysh -c 'sh ip bgp summ'|awk '{print $10}'|egrep -v '^$'|grep -v 'State'|grep 'Active'|wc
     42      42     294
So that’s 40 neighbors that will never successfully send a prefix. I don’t know why or what, I just know this is what happens. I saw the same thing with the other two hardware platforms.
This would be better if bgperf tracked the neighbors that have successfully sent any prefixes, but that’s going to take more work.
prefixes received at the monitor:
number of neighbors that the target has received all it’s prefixes:
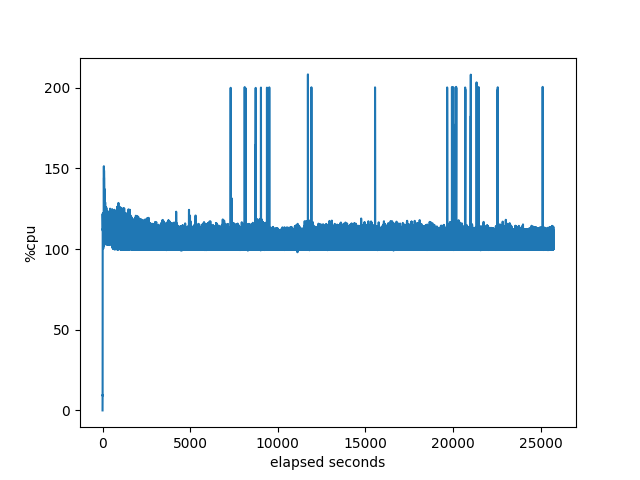
CPU utilization of the target:
memory used by target:
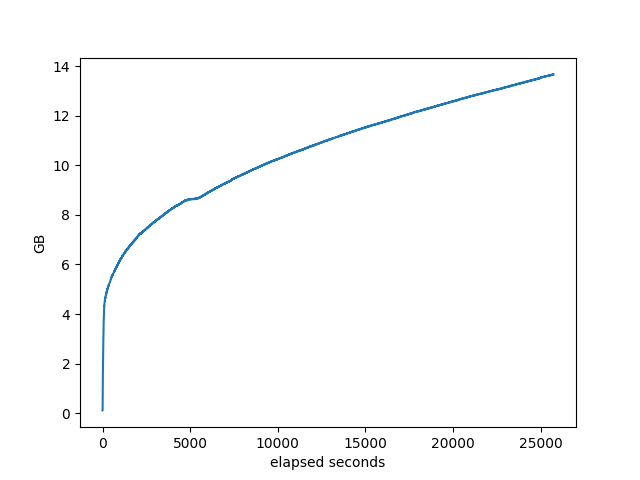
% idle of the machine. This shows that there are plenty of CPU resources available.
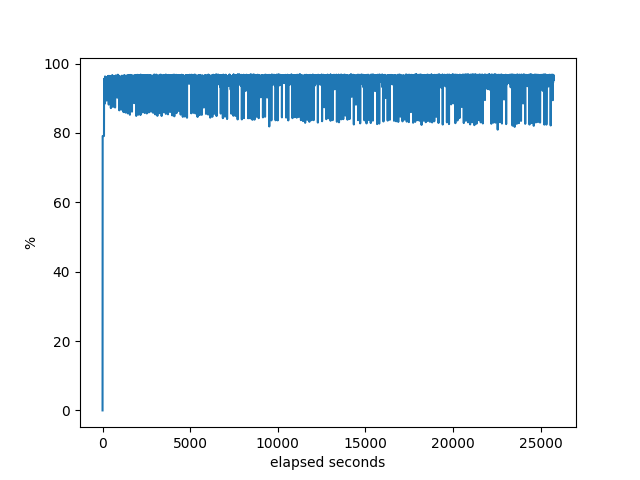
I don’t see anything interesting in these graphs.
BIRD
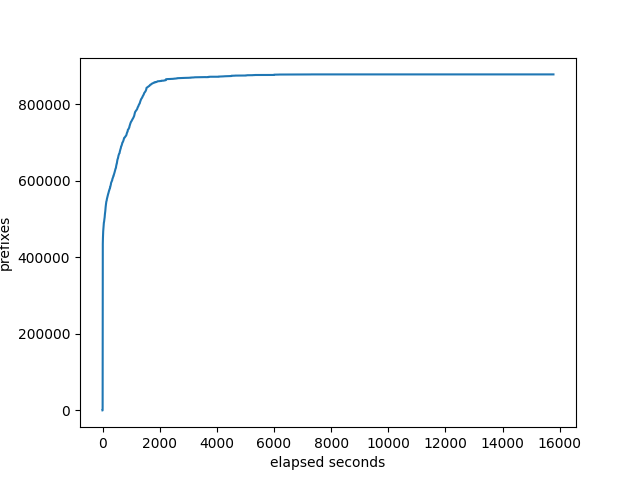
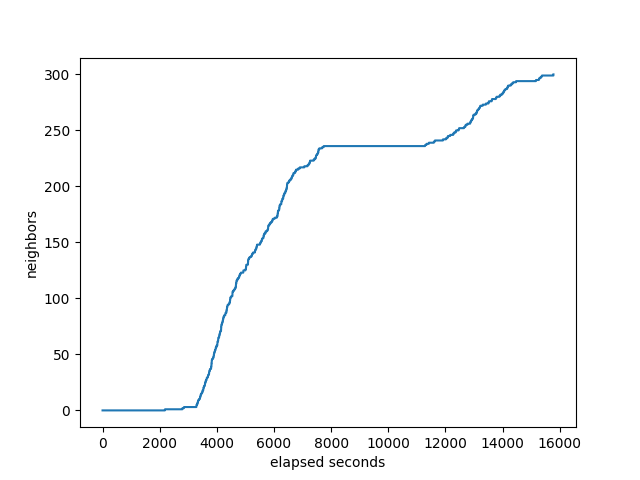
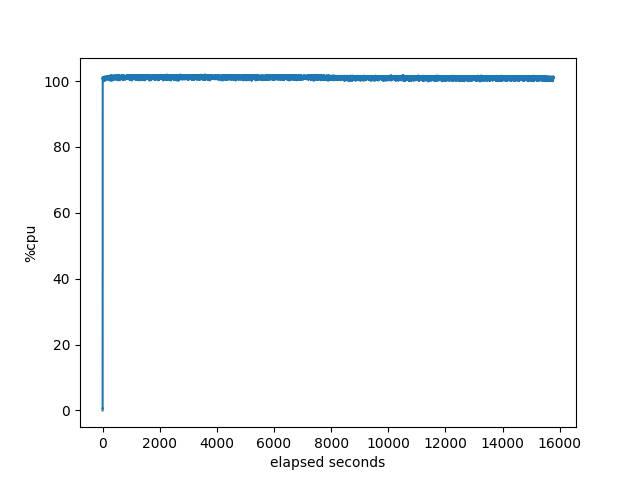
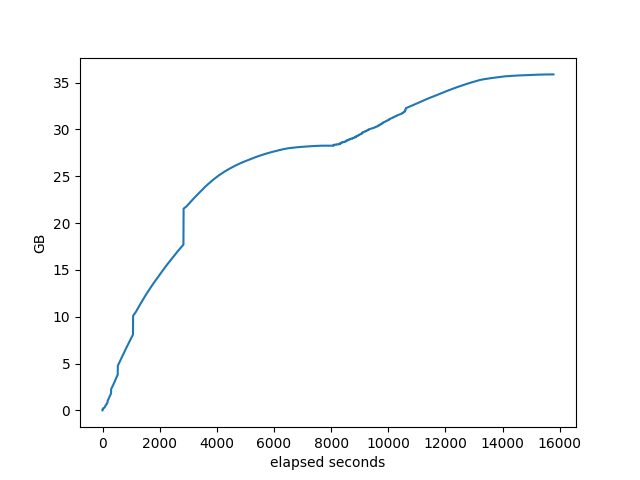
BIRD succeeds at 200 neighbors, and fails at 300. Well, it gets stuck not incrementing either the prefixes received at the monitor or the number of neighbors completed. I usually have a 120s timeout, but I changed it to one hour. As you can see on the graphs, it got stuck for almost an hour at about 225 neighbors. I don’t know what it was doing at that point in time. The total time was 15781s, more than 4 hours. That doesn’t really count as success. It gets to about 225 neighbors in less than half that time.
prefixes received at the monitor:
number of neighbors that the target has received all it’s prefixes:
CPU utilization of the target:
memory used by target:
% idle of the machine:
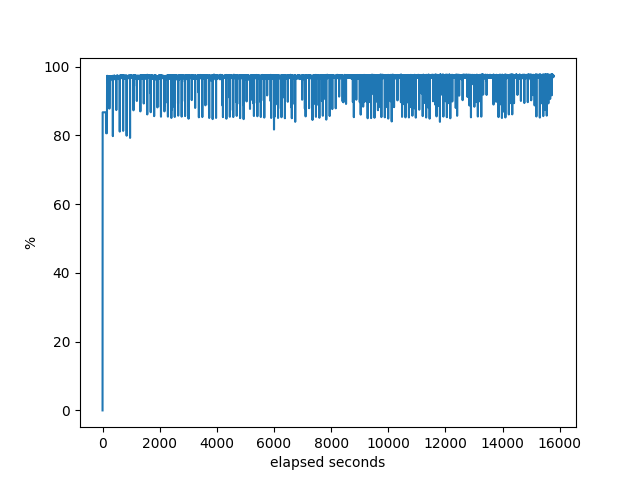
Other than the neighbor graph showing it getting stuck for almost an hour, nothing much interesting going on here.
OpenBGPD
OpenBGPD at 300 finishes, but takes so long that I’m not sure that should really count. Well, I didn’t let it finish, it was going to ran out of memory on the machine I was using, it was past my bedtime and I didn’t want to get charged for a machine over night.
prefixes received at the monitor:
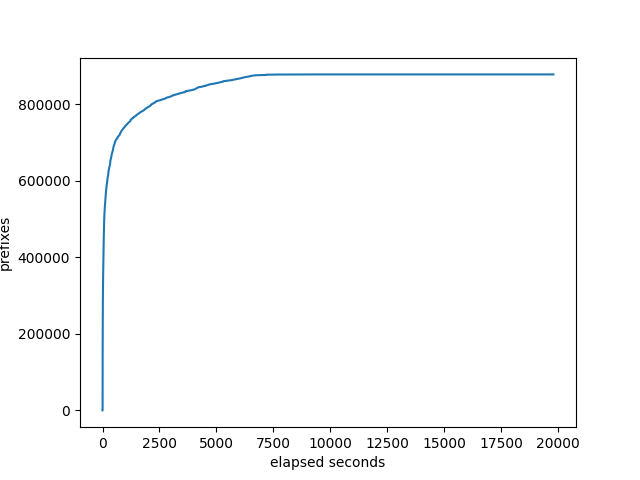
number of neighbors that the target has received all it’s prefixes:
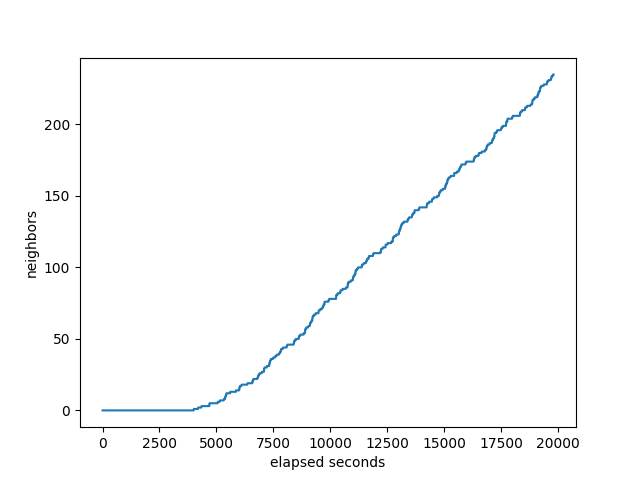
CPU utilization of the target:
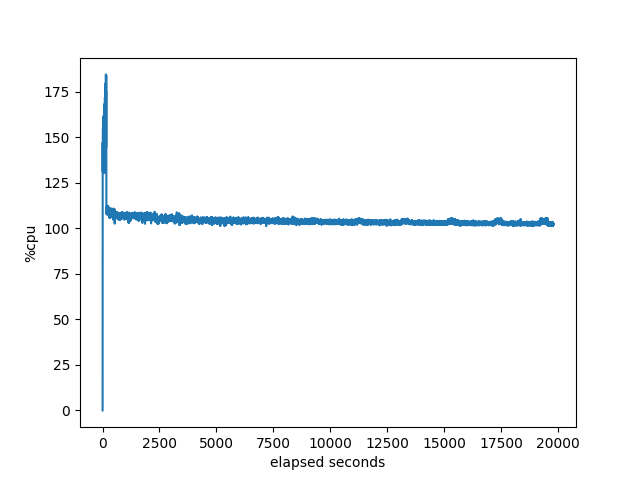
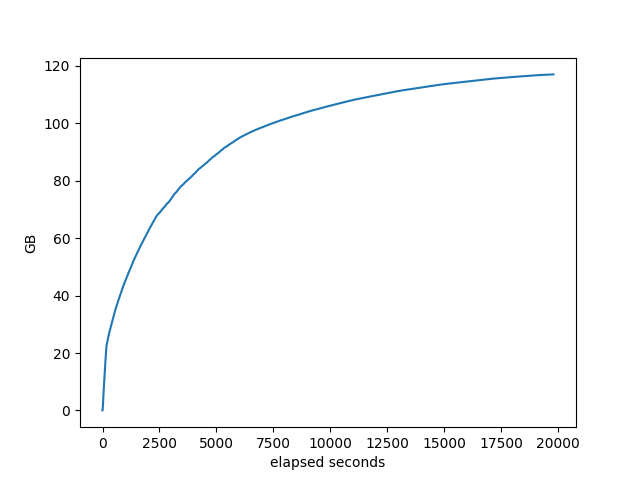
memory used by target:
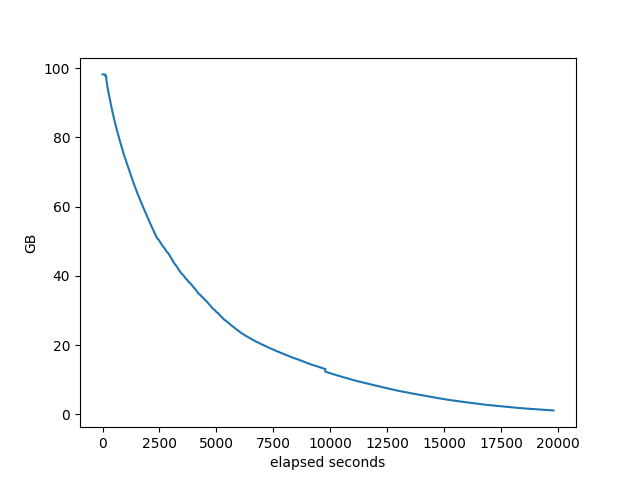
% idle of the machine:
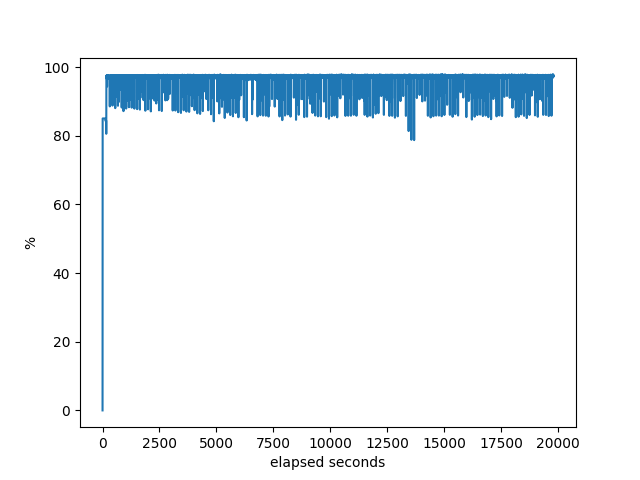
I don’t see anything interesting in these other than in comparing to the other stacks, which we did above.
RustyBGP
I successfully tested RustyBGP with 500 neighbors on the M5.24xlarge which has 96 cores and 384 GB of RAM. More neighbors than that ran into a problem I mentioned in the previous blog post. Every second bgperf collects information from the target about how many prefixes have been received by each neighbor. After a while, in some of the tests RustyBGP stops responding to that data, which completely freaks out bgperf and it fails. I don’t know if the problem is that there isn’t enough CPU resources or something else. In other words, if RustyBGP had it’s own dedicated resource and bgpdump2 it’s own dedicated resources would this break? I can’t be sure but I kind of think it would still fail since bgpdump2 does it’s greatest work at the beginning when it’s starting up which means that there shouldn’t be contention from the rest of the system.
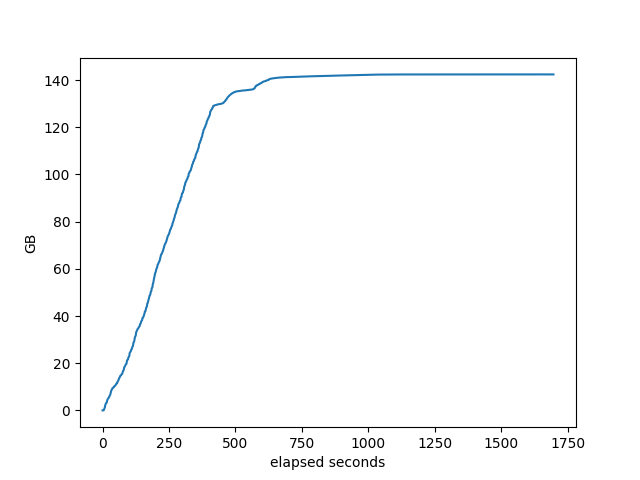
At 500, it finishes in about 1700 seconds, which is not that much longer than the other three took to do 100 neighbors.
Because RustyBGP can handle so much more load, it’s more interesting to see how it scales.
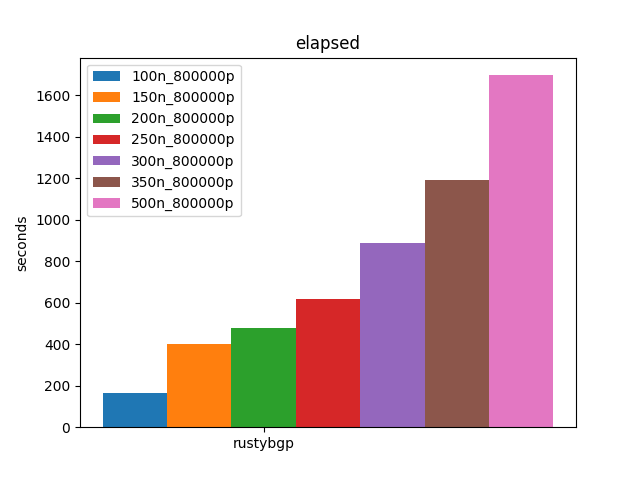
Well, that scales very well. Pretty cool!
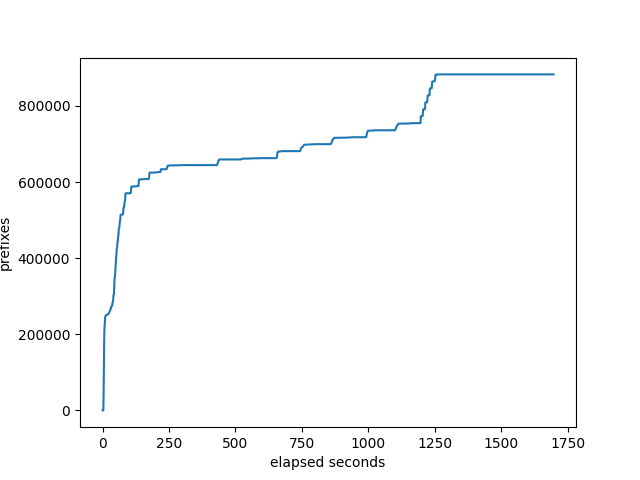
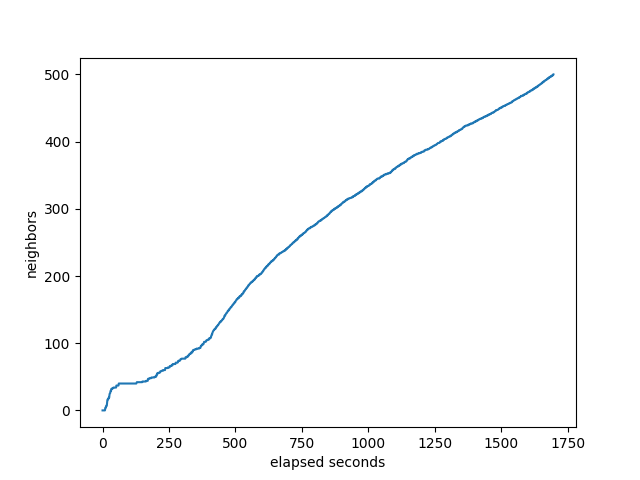
Let’s look at the benchmark stats like the other stacks:
prefixes received at the monitor:
number of neighbors that the target has received all it’s prefixes:
memory used by target
The % idle of the machine.
Conclusion
Is it important to test 1000 neighbors with full internet routes? Probably only for a small number of people. Can we learn something anyway? One of my hopes in all of these BGP performance posts is that more people realize that it’s possible to do performance testing and there are thigs to learn. Also, maybe there are things that haven’t been possible in the past that could be done with very high performing BGP stacks.
Is it reasonable to test 1000 neighbors with full internet routes using bgperf? Porbably, though I didn’t get past 500 neighbors. It is likely that 1000 neighbors would have needed more memory than the max I used, which was 384 GB. That is available on other EC2 instances. At some point it would be necessary to figure out multi-host bgperf. So I think it would work, but I couldn’t prove it here. Each of these host platforms performed fine and there isn’t much difference in performance unless you run out of memory.
However, only RustyBGP can get near 1000 neighbors. And it requires a lot of memory. Both for RustyBGP and for the testers. If you require loads anywhere like this you need a BGP stack that can use multiple cores. However, I don’t think RustyBGP is production ready, but it’s promising.
FRRouting breaks first, before 150 neighbors. OpenBGPD completes at 300 neighbors but it takes so long I don’t think it’s practical. It struggles even at 150. Next is BIRD at between 200 and 250 neighbors, let’s say 225.
I also added new graphs to see what these stacks are doing. I’m still trying to understand how they are useful. They are useful in showing things like when BIRD gets stuck for almost an hour. However, the fact that OpenBGPD has a different curve for neighbors than FRRouting, I don’t know if that’s important or not.