- 1st Post Comparing Open Source BGP Stacks
- 2nd Post Followup Measuring BGP Stacks Performance
- 3rd Post Comparing Open Source BGP stacks with internet routes
- 5th Post BGP Performance 5 – 1000 full internet neighbors
- 6th Post BGP Performance testing with filtering
- 7th Post Performance testing of Commercial BGP
After the last post, I thought the this post would be either adding interesting BGP policy. But that’s tricky. It’s going to take some rethinking about how bgperf measures when a test is done, figuring out what filter is useful is hard, and also I want a little bit of a multi-vendor approach because there are already 5 NOSes and I want to add more. In the meantime, Maria Matejka maria.matejka@nic.cz added a BIRD generator in place of ExaBGP because BIRD is faster and uses less memory. Also, Fujita Tomonori updated RustyBGP based on the results I found and improved it’s performance. In seeing the affect of each of these I discovered some things I’m surprised about.
Remember, these posts are as much about me figuring out how to test BGP stacks as they are about actually measuring those stacks. This episode will talk about some of the changes that I’ve made and what they mean. The test infrastructure influences the results more than I might like. I think that’s mostly okay because mostly the results are about comparing between stacks so the differences should still pop out. That’s not always going to be true; sometimes differences will be masked.
These tests use the same versions of NOSes as before except for RustyBGP. It’s using the latest as of 2021-09-11.
I tried using BIRD as a generator instead of Exa. In the process I’ve added a little more sophistication to bgperf. Now if it sees the amount of prefixes received at the monitor and the number of neighbors complete hasn’t changed for 30 intervals (seconds) it fails the test. Also if the number of prefixes received at the monitor drops for more than 5 intervals then it fails.
I’m starting to get to the place where I find weird things, maybe because of the test infrastructure, maybe because of specific BGP stack behavior, and adapting and figuring out what’s going on takes extra time.
Let’s get to the data
Unique prefixes using BIRD and ExaBGP as tester
If there isn’t an entry for a BGP stack, it’s because the test failed for one of the reasons above: 30 seconds stuck at the same number of prefixes received at the monitor or the number of prefixes dropped for 5 seconds.
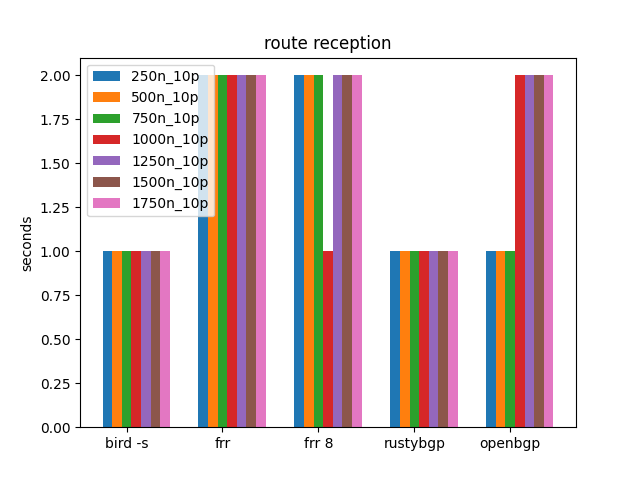
I know that some aspects of the test mechanism shows
10 prefixes
BIRD as tester
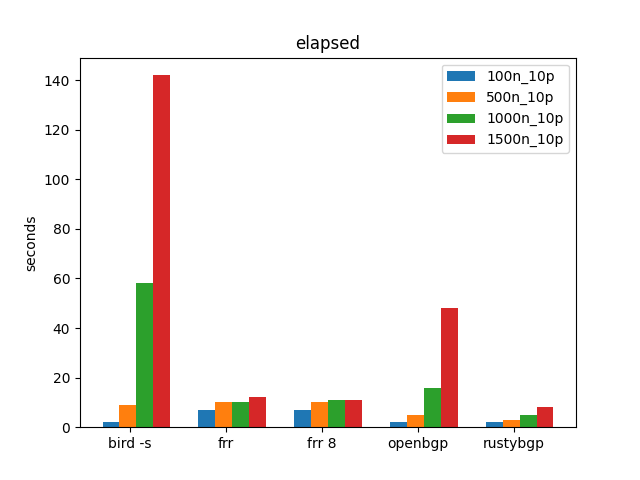
This isn’t what I expected. I don’t remember BIRD doing so poorly. Something is going on when BIRD has many neighbors.
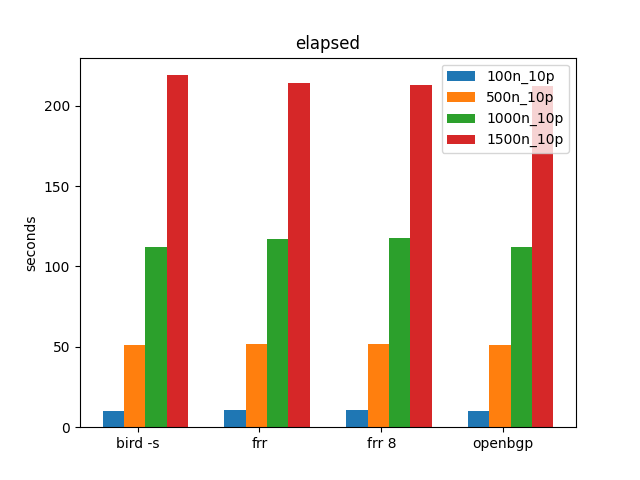
ExaBGP as tester
These aren’t the results I remember, let’s actually look at what we saw before.
These are the results from the 2nd post. Why is it so different than the Exa results bgperf creates now? It’s about what to measure measuring and when things are started. There are three things in bgperf: tester, monitor, and target. Each has to start up, connect to the right neighbors, and then the tester needs to send all the routing updates. Originally bgperf started the tester, started the target, started the monitor, waited for the monitor to connect, then started the elapsed timer. This masks a bunch of data that the tester has already sent to the target. Also, bgpdump2 as tester doesn’t work if you start the tester before the target. So I changed the order of things and now in the elapsed there is some amount of tester startup time, but during that time the tester is sending traffic to the target.
Because of the way bgperf was trying to exclude the tester time we masked a problem with BIRD. bummer.
Now bgperf includes tester time in it, because the tester is sending traffic to the traffic. The faster the tester startup the better.
Is this current method better? I think so. Good enough? I hope so. It would be better if we established all the BGP sessions and then just started all the sending at the same time. There might be a way to do that with using policy on the receiver, but that’s more work and sophistication in bgperf I don’t have.
For now, the best bet is to use BIRD as generator and not use Exa.
So does BIRD have a problem with many neighbors? Yes, and I didn’t see that until BIRD was also the tester.
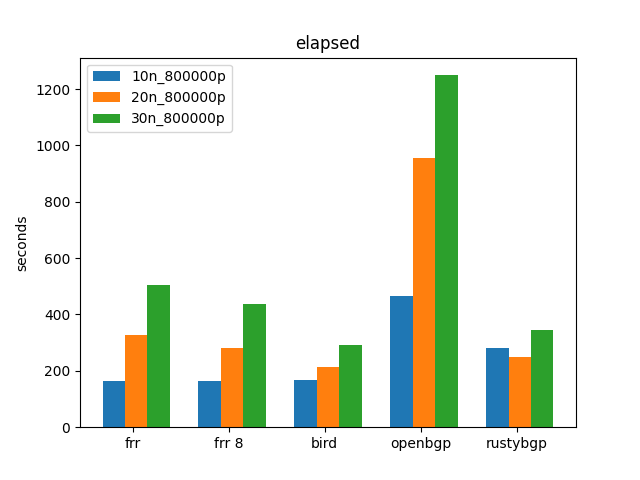
BIRD as tester / generator with many many neighbors
This is a test that is harder than I did previously with ExaBGP. I couldn’t get Exa to do 1000 prefixes for this many neighbors. This might not be a realistic set of tests. I don’t know if people have 1000 prefixes from 1500 neighbors. But as we’ll see, it shows interesting results.
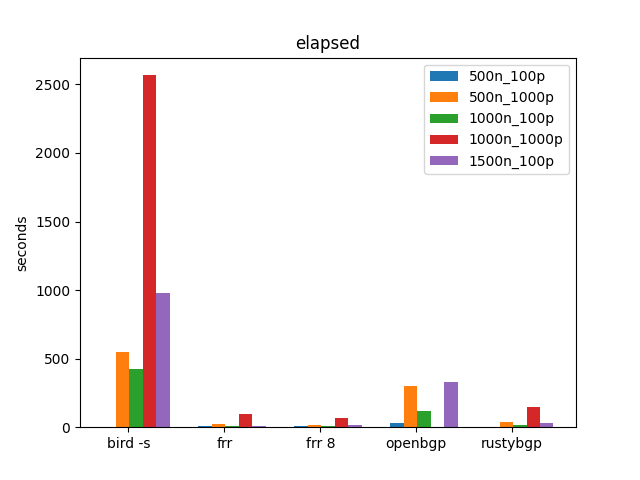
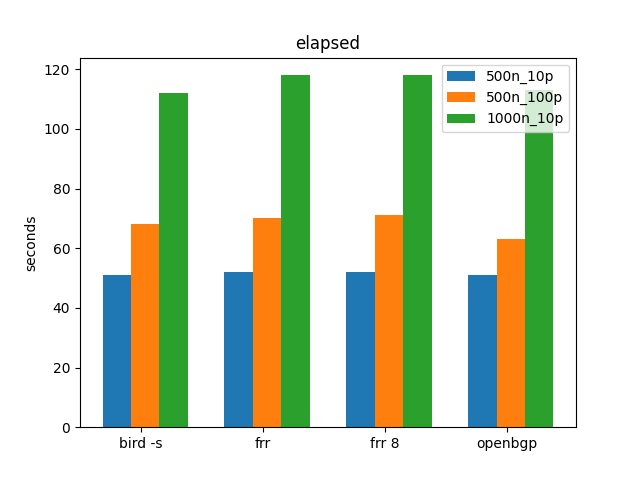
BIRD is considerably worse than everything else; I had forgotten about previous results. Looking back at the second post in the section about extreme tests, BIRD does much worse than everybody else at 1000 neighbors, 10 prefixes, or 500+ neighbors, 1000 prefixes. That’s what we are seeing here as well. I had just forgotten those results. It’s just that with BIRD as a tester it’s faster and easier to test these extremes.
Though it’s hard to see in this graph because of BIRD’s outsized times, but RustyBGP looks like it got better than it was before. It’s still slower than FRR, but not 10x slower.
OpenBGPD fails at 1000n_1000p because it runs out of memory on my 64 GB machine and is killed off by the Linux kernel.
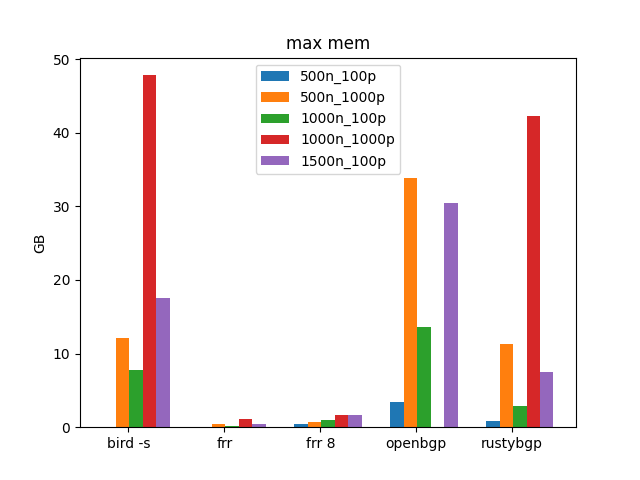
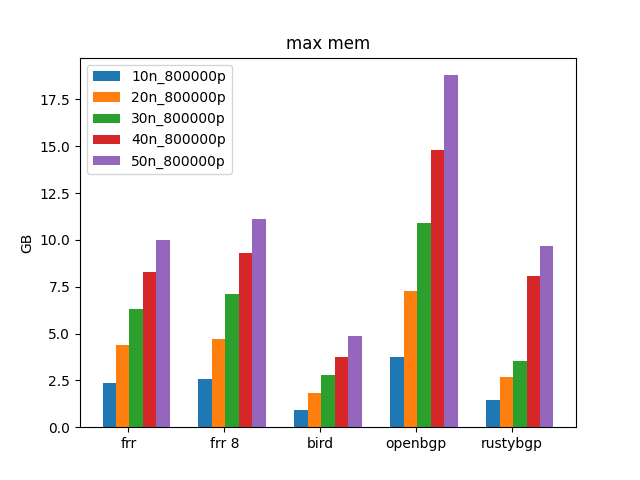
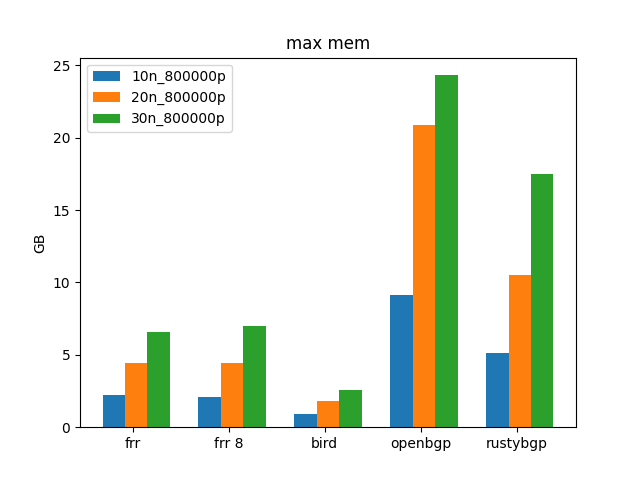
BIRD is using a lot more memory than we’ve see it. Actually, I think something weird is going on in the way bgperf is measuring memory in this case that I haven’t seen before. But I only see this for BIRD.
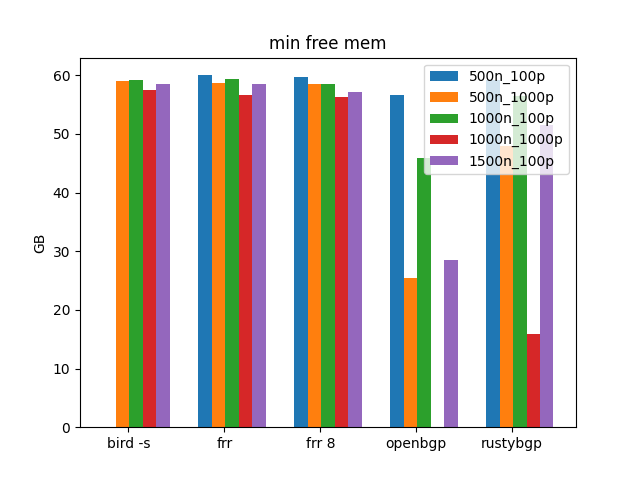
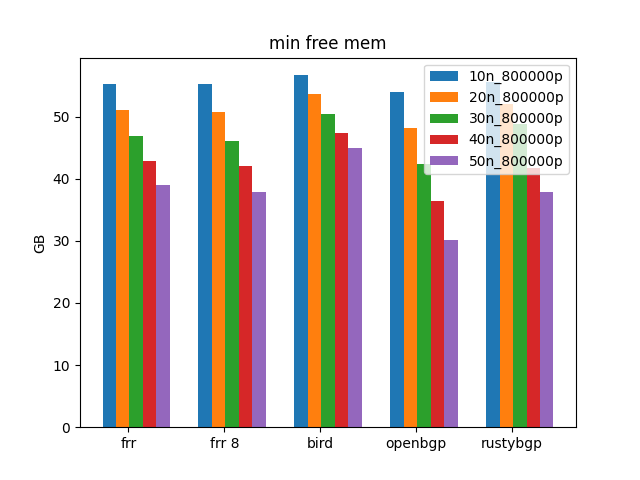
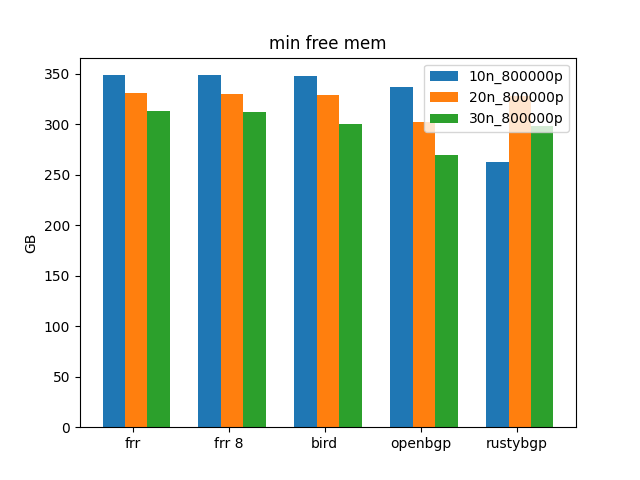
This graphs shows the minimum free on the 64 GB machine I’m using for this test. with BIRD there’s lots of free memory. Whereas with OpenBGPD and RustyBGP the min free lines up with the amount free. I’m not sure what’s going on here, it’s weird.
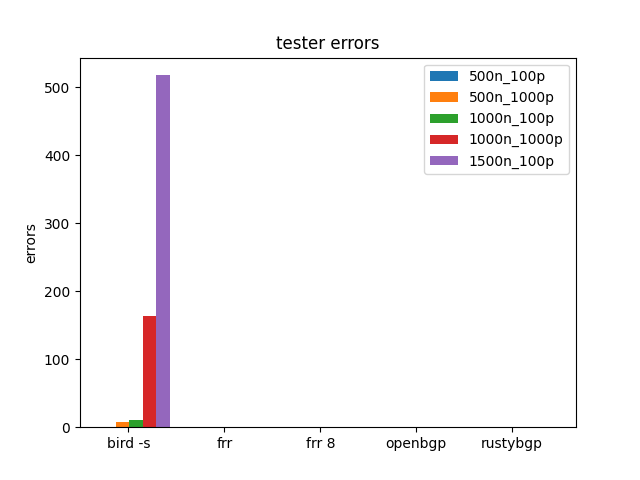
These errors are counted based on grepping the BIRD tester logs. Actually, more tests have errors, but all these graphs only show tests that finish. So any test that FAILED might also have tester errors.
grep RMT /tmp/bgperf/tester/*.log | grep -v NEXT_HOP
Usually these errors are hold timers expiring
BIRD Tester data
ExaBGP many neighbors
Just to make sure that the other changes made don’t give us different results, also ran similar tests using ExaBGP as the tester.
ok, again, Exa as tester is really masking what’s going on.
Except, I cannot get RustyBGP to work with ExaBGP as the tester. I just get
$ more /tmp/bgperf/rustybgp/rustybgp.log
Hello, RustyBGPd (32 cpus)!
10.10.0.2: down std::io::Error
10.10.0.3: notification 5 2
I think that means a BGP Error (Notification) code of 5,2, which would be FSM, Receive Unexpected Message in OpenConfirm State.
I did no debugging. Exa works with all the other BGP stacks just fine, and RustyBGP works with the other testers, so I don’t know what’s going on.
MRT Tests
These tests replay real internet routing tables. The specific MRT file used for these tests was http://archive.routeviews.org/bgpdata/2021.08/RIBS/rib.20210801.0000.bz2
Bgpdump2 again
OpenBGPD vs bgpdump2
We have to start by seeing if we can fix the results from OpenBGPD. Last time I noticed that with Bgpdump2 as the tester, OpenBGPD as the target and 30 neighbors, OpenBGPD stalled and then dropped a neighbor. I’ve added a new errors column in the stats. For BIRD and Bgpdump2 as testers, it will grep the tester logs to see if there are errors and count them. However, there is something going on. It appears bgpdump2 is sending all the data twice. It sends it, waits several seconds and sends it again. This seems to be happening with any and every target. This second time it sends it to openbgpd, for some reason on one of the testers is fails.
The client has this in the log:
$ grep -i error /tmp/bgperf/mrt-injector*/*.log
/tmp/bgperf/mrt-injector28/bgpdump2.log:Sep 21 17:14:33.670281 Notification Error: UPDATE Message Error (3), Malformed AS_PATH (11)
/tmp/bgperf/mrt-injector29/bgpdump2.log:Sep 21 17:18:19.390782 Notification Error: UPDATE Message Error (3), Malformed AS_PATH (11)
I did finally get logging working for OpenBGPD; It’s logs have:
neighbor 10.10.0.32: bad path, starting with 64550, enforce neighbor-as enabled
neighbor 10.10.0.32: sending notification: error in UPDATE message, AS-Path unacceptable
neighbor 10.10.0.32: state change Established -> Idle, reason: Fatal error
neighbor 10.10.0.32: state change Idle -> Active, reason: Start
neighbor 10.10.0.32: state change Active -> OpenSent, reason: Connection opened
neighbor 10.10.0.32: Received multi protocol capability:  unknown AFI 1, safi 4 pair
neighbor 10.10.0.32: Received multi protocol capability:  unknown AFI 2, safi 4 pair
neighbor 10.10.0.32: state change OpenSent -> OpenConfirm, reason: OPEN message received
neighbor 10.10.0.32: state change OpenConfirm -> Established, reason: KEEPALIVE message received
ok, OpenBGPD is doing a check that the other’s don’t do by default. so let’s change OpenBGPD config to add ‘enforce neighbor-as no’ and see if we get better results. SUCCESS
elapsed: 238sec, cpu: 2.06%, mem: 10.87GB, mon recved: 878387, neighbors: 30, %idle 98.31, free mem 42.44GB
openbgp: OpenBGPD 7.1
Max cpu: 126.81, max mem: 10.87GB
Min %idle 79.06, Min mem free 42.44GB
Time since first received prefix: 235
total time: 255.89s
tester errors: 0

name, target, version, peers, prefixes per peer, required, received, monitor (s), elapsed (s), prefix received (s), testers (s), total time, max cpu %, max mem (GB), min idle%, min free mem (GB), flags, date,cores,Mem (GB), tester errors, failed, MSG
openbgp,openbgp,OpenBGPD 7.1,30,800000,800000,878387,0,238,3,235,255.89,127,10.87,79,42.442,-s,2021-09-21,32,62.82GB,0,
RustyBGP
To see if RustyBGP can do better than it did before. These results might not be exactly the same as before because bgperf now checks to see if things are stalled or prefixes count is dropping.
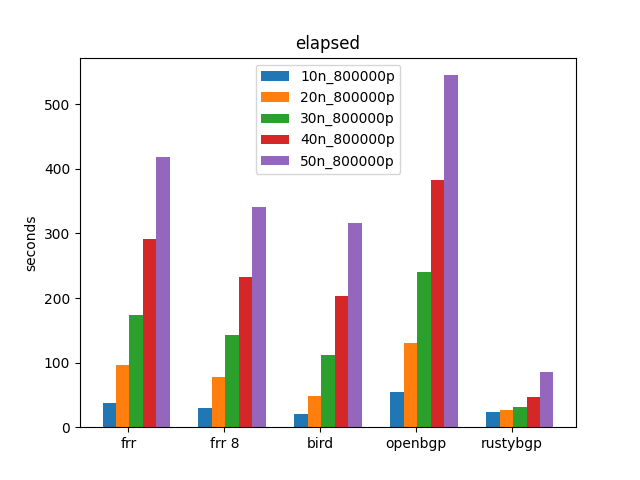
Yep, RustyBGP is considerably better than before and now the fastest in this test.
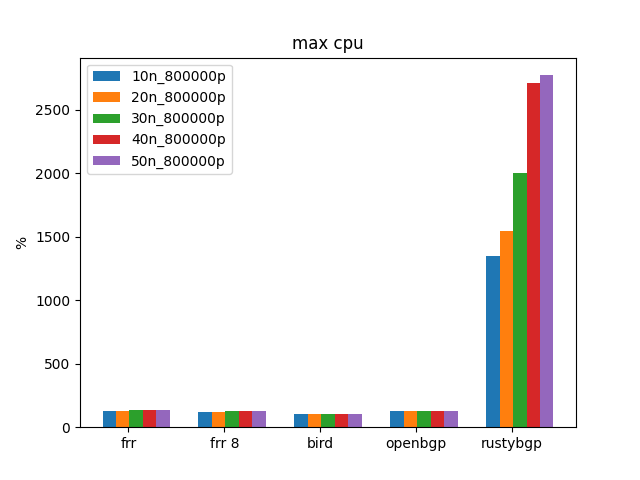
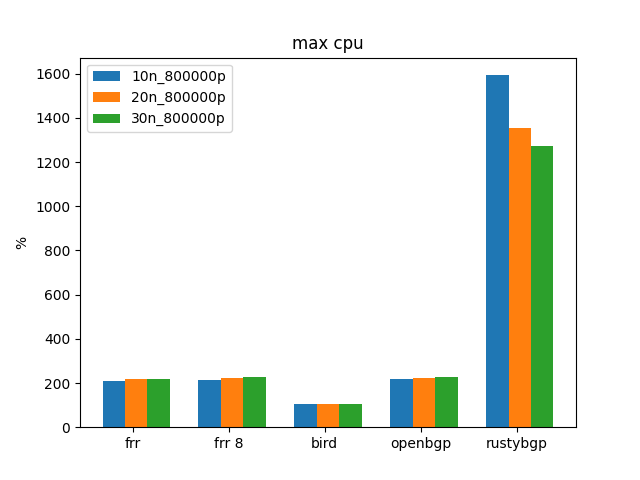
Finally we are seeing what I’d hoped to see when I started this, a BGP stack that used more CPU resources and was faster than the others. woot woot.
Why aren’t there any tester errors? That’s because any test that FAILED, we don’t put in graphs. But if we look at the data directly for all the FAILED, we can see that for all the OpenBPGD fails, it did notice errors (which is the last column before the FAIL.)
bgpdump2 data
GoBGP MRT
RustyBGP isn’t faster than the others in this test, but is faster than it was last post.
Hold Timers
What should BGP Hold Timer be for a test like this? The default is 90 seconds, but if the test doesn’t even take 90 seconds then we aren’t testing if hold timers will work. Should we expect aggressive hold timers to be able to work? I don’t know. I started some tests here, but am not sure what they mean yet. Probably the beginning of another investigation.
I’ve not been paying attention to Hold Timers before this.
While not exactly the same data, let’s compare how many tests failed with default timers vs 5 second hold timer.
he columns that we are showing here are free memory in the machine, tester errors and if the test failed. What we are looking or is if memory gets really low. Other than the above time OpenBGPD runs out of memory, running out of memory and being killed off is not the problem we see here.
Default Timers:
$ awk 'BEGIN{FS=","};{print $1 "," $4 "," $5 "," $16 "," $21 "," $23}' lots_bird.csv|grep FAIL
bird -s,500,1000,59.699,0,FAILED: stuck received count 495000 neighbors_checked 495
bird -s,1000,100,60.039,2,FAILED: stuck received count 75400 neighbors_checked 754
bird -s,1000,1000,58.138,11,FAILED: stuck received count 961000 neighbors_checked 961
openbgp,1000,1000,0.012,1000,FAILED: dropping received count 0 neighbors_checked 1000
bird -s,1500,100,58.64,0,FAILED: stuck received count 100000 neighbors_checked 1000
The BIRD failures are the ones are the results that we talked about at the beginning of this post and the OpeBGPD is because it ran out of memory.
5 second timers
$ awk 'BEGIN{FS=","};{print $1 "," $4 "," $5 "," $16 "," $21 "," $23}' birt_many_5.csv|grep FAIL
bird -s,500,100,59.411,0,FAILED: stuck received count 47300 neighbors_checked 473
rustybgp,500,1000,50.673,279,FAILED: dropping received count 221000 neighbors_checked 221
bird -s,1000,100,58.536,13,FAILED: stuck received count 97700 neighbors_checked 977
rustybgp,1000,100,55.833,324,FAILED: dropping received count 67600 neighbors_checked 676
bird -s,1000,1000,56.837,13,FAILED: stuck received count 1000000 neighbors_checked 0
frr,1000,1000,56.073,0,FAILED: stuck received count 1000000 neighbors_checked 728
frr 8,1000,1000,56.035,0,FAILED: stuck received count 1000000 neighbors_checked 0
openbgp,1000,1000,0.048,1000,FAILED: dropping received count 0 neighbors_checked 0
rustybgp,1000,1000,2.922,1553,FAILED: dropping received count 631588 neighbors_checked 222
bird -s,1500,10,59.528,1,FAILED: stuck received count 14020 neighbors_checked 1101
rustybgp,1500,10,58.788,14,FAILED: dropping received count 14860 neighbors_checked 1486
bird -s,1500,100,59.177,67,FAILED: stuck received count 150000 neighbors_checked 653
frr 8,1500,100,58.367,0,FAILED: stuck received count 150000 neighbors_checked 0
openbgp,1500,100,28.934,0,FAILED: stuck received count 150000 neighbors_checked 0
rustybgp,1500,100,48.041,897,FAILED: dropping received count 138811 neighbors_checked 720
Many Many more failures here. I don’t have a specific pattern here. You can see that every stack had some problems. I think RustyBGP has the most problems with the hold timer set to 5 seconds. BIRD doesn’t really have more failures than before though it does have more hold timer expirations than before.
I assume very few network designs rely on 5 second hold timers, but I wonder if that is just because it’s never been reliable. I see things a little different. It’s 2021 and for any other distributed database to not know it’s neighbors were down in 5 seconds is a very long time. Maybe that’s too ideological and not practical. I’m just measuring for now. If you want aggressive hold timers then you need to be careful and probably should at least monitor hold timer expirations and see if they are being impacted.
RustyBGP
Something especially strange is going on with RustyBGP and 5 second hold timers.
If I run a 1000 neighbor, 100 prefix test
$ python3 bgperf.py bench -n1000 -s -trustybgp -p100 -gbird
I get this output
elapsed: 15sec, cpu: 1544.60%, mem: 2.60GB, mon recved: 76822, neighbors: 461, %idle 44.67, free mem 57.27GB
elapsed: 16sec, cpu: 899.67%, mem: 2.60GB, mon recved: 73200, neighbors: 732, %idle 76.98, free mem 57.27GB
elapsed: 17sec, cpu: 18.02%, mem: 2.60GB, mon recved: 73200, neighbors: 732, %idle 98.84, free mem 57.28GB
elapsed: 18sec, cpu: 17.98%, mem: 2.60GB, mon recved: 73200, neighbors: 732, %idle 99.06, free mem 57.28GB
elapsed: 19sec, cpu: 17.65%, mem: 2.60GB, mon recved: 73200, neighbors: 732, %idle 98.56, free mem 57.28GB
elapsed: 20sec, cpu: 9.64%, mem: 2.60GB, mon recved: 73200, neighbors: 732, %idle 98.59, free mem 57.28GB
elapsed: 21sec, cpu: 17.24%, mem: 2.60GB, mon recved: 73200, neighbors: 732, %idle 98.34, free mem 57.28GB
elapsed: 22sec, cpu: 18.13%, mem: 2.60GB, mon recved: 73200, neighbors: 732, %idle 99.03, free mem 57.27GB
elapsed: 24sec, cpu: 18.13%, mem: 2.60GB, mon recved: 73200, neighbors: 732, %idle 99.12, free mem 57.28GB
elapsed: 25sec, cpu: 17.47%, mem: 2.60GB, mon recved: 73200, neighbors: 732, %idle 98.53, free mem 57.28GB
elapsed: 26sec, cpu: 18.56%, mem: 2.60GB, mon recved: 73200, neighbors: 732, %idle 98.53, free mem 57.28GB
elapsed: 27sec, cpu: 18.09%, mem: 2.60GB, mon recved: 73200, neighbors: 732, %idle 98.9, free mem 57.28GB
elapsed: 28sec, cpu: 18.94%, mem: 2.60GB, mon recved: 73200, neighbors: 732, %idle 98.84, free mem 57.28GB
elapsed: 29sec, cpu: 17.82%, mem: 2.60GB, mon recved: 73200, neighbors: 732, %idle 98.94, free mem 57.28GB
elapsed: 30sec, cpu: 9.70%, mem: 2.60GB, mon recved: 73200, neighbors: 732, %idle 98.59, free mem 57.28GB
elapsed: 31sec, cpu: 17.87%, mem: 2.60GB, mon recved: 73200, neighbors: 732, %idle 98.53, free mem 57.28GB
elapsed: 32sec, cpu: 18.46%, mem: 2.60GB, mon recved: 73200, neighbors: 732, %idle 98.5, free mem 57.28GB
elapsed: 33sec, cpu: 17.12%, mem: 2.60GB, mon recved: 73200, neighbors: 732, %idle 99.15, free mem 57.28GB
elapsed: 34sec, cpu: 17.47%, mem: 2.60GB, mon recved: 73200, neighbors: 732, %idle 98.87, free mem 57.27GB
elapsed: 35sec, cpu: 17.15%, mem: 2.60GB, mon recved: 73200, neighbors: 732, %idle 98.78, free mem 57.27GB
elapsed: 37sec, cpu: 17.49%, mem: 2.60GB, mon recved: 73200, neighbors: 732, %idle 98.74, free mem 57.27GB
elapsed: 38sec, cpu: 17.35%, mem: 2.60GB, mon recved: 73200, neighbors: 732, %idle 98.38, free mem 57.28GB
elapsed: 39sec, cpu: 13.76%, mem: 2.60GB, mon recved: 73200, neighbors: 732, %idle 98.59, free mem 57.28GB
elapsed: 40sec, cpu: 14.40%, mem: 2.60GB, mon recved: 73200, neighbors: 732, %idle 98.71, free mem 57.28GB
elapsed: 41sec, cpu: 17.91%, mem: 2.60GB, mon recved: 73200, neighbors: 732, %idle 98.34, free mem 57.27GB
elapsed: 42sec, cpu: 18.72%, mem: 2.60GB, mon recved: 73200, neighbors: 732, %idle 98.16, free mem 57.28GB
elapsed: 43sec, cpu: 18.58%, mem: 2.60GB, mon recved: 73200, neighbors: 732, %idle 99.53, free mem 57.28GB
elapsed: 44sec, cpu: 18.32%, mem: 2.60GB, mon recved: 73200, neighbors: 732, %idle 98.81, free mem 57.27GB
elapsed: 45sec, cpu: 16.95%, mem: 2.60GB, mon recved: 73200, neighbors: 732, %idle 98.75, free mem 57.28GB
elapsed: 46sec, cpu: 17.83%, mem: 2.60GB, mon recved: 73200, neighbors: 732, %idle 98.74, free mem 57.28GB
elapsed: 47sec, cpu: 17.97%, mem: 2.60GB, mon recved: 73200, neighbors: 732, %idle 98.5, free mem 57.28GB
elapsed: 48sec, cpu: 17.58%, mem: 2.60GB, mon recved: 73200, neighbors: 732, %idle 98.47, free mem 57.28GB
elapsed: 50sec, cpu: 9.58%, mem: 2.60GB, mon recved: 73200, neighbors: 732, %idle 98.93, free mem 57.28GB
elapsed: 51sec, cpu: 18.82%, mem: 2.60GB, mon recved: 73200, neighbors: 732, %idle 98.68, free mem 57.28GB
elapsed: 52sec, cpu: 18.04%, mem: 2.60GB, mon recved: 73200, neighbors: 732, %idle 97.64, free mem 57.28GB
elapsed: 53sec, cpu: 18.17%, mem: 2.60GB, mon recved: 73200, neighbors: 732, %idle 98.97, free mem 57.28GB
elapsed: 54sec, cpu: 17.44%, mem: 2.60GB, mon recved: 73200, neighbors: 732, %idle 99.0, free mem 57.27GB
elapsed: 55sec, cpu: 56.28%, mem: 2.60GB, mon recved: 73700, neighbors: 733, %idle 97.5, free mem 57.27GB
elapsed: 56sec, cpu: 762.16%, mem: 2.66GB, mon recved: 76200, neighbors: 746, %idle 91.11, free mem 57.25GB
elapsed: 57sec, cpu: 964.33%, mem: 2.77GB, mon recved: 79600, neighbors: 776, %idle 57.28, free mem 57.04GB
elapsed: 58sec, cpu: 782.17%, mem: 2.85GB, mon recved: 81300, neighbors: 801, %idle 75.38, free mem 56.98GB
elapsed: 59sec, cpu: 897.75%, mem: 2.95GB, mon recved: 83300, neighbors: 826, %idle 69.76, free mem 56.89GB
elapsed: 60sec, cpu: 677.62%, mem: 3.01GB, mon recved: 84800, neighbors: 840, %idle 72.8, free mem 56.84GB
elapsed: 62sec, cpu: 671.89%, mem: 3.08GB, mon recved: 87100, neighbors: 863, %idle 63.75, free mem 56.75GB
elapsed: 63sec, cpu: 724.63%, mem: 3.21GB, mon recved: 88800, neighbors: 884, %idle 72.86, free mem 56.68GB
elapsed: 64sec, cpu: 741.47%, mem: 3.28GB, mon recved: 90500, neighbors: 902, %idle 71.88, free mem 56.61GB
elapsed: 65sec, cpu: 729.52%, mem: 3.34GB, mon recved: 92300, neighbors: 919, %idle 78.9, free mem 56.56GB
elapsed: 66sec, cpu: 577.34%, mem: 3.39GB, mon recved: 93700, neighbors: 932, %idle 71.59, free mem 56.50GB
elapsed: 67sec, cpu: 743.86%, mem: 3.45GB, mon recved: 95700, neighbors: 952, %idle 74.8, free mem 56.44GB
elapsed: 68sec, cpu: 1014.57%, mem: 3.53GB, mon recved: 97600, neighbors: 952, %idle 67.34, free mem 56.37GB
elapsed: 69sec, cpu: 888.66%, mem: 3.61GB, mon recved: 99400, neighbors: 975, %idle 63.75, free mem 56.28GB
elapsed: 70sec, cpu: 568.37%, mem: 3.65GB, mon recved: 100000, neighbors: 994, %idle 73.4, free mem 56.22GB
elapsed: 71sec, cpu: 158.26%, mem: 3.66GB, mon recved: 100000, neighbors: 1000, %idle 98.81, free mem 56.20GB
rustybgp: rustybgpd
Max cpu: 1592.89, max mem: 3.66GB
Min %idle 35.88, Min mem free 56.20GB
Time since first received prefix: 70
total time: 167.32s
tester errors: 268
Notice that it gets stuck at 732 neighbors for 41 seconds, and also the CPU usage from RustyBGP is much lower during that time. I do not know what’s going on here. There are 268 errors which are all Hold timer expired. I think this seems a problem, but I don’t know.
What did we learn?
I thought I’d learned about a BIRD performance issue, but it turns out I already knew that, but using BIRD to measure BIRD makes it more obvious. Also, are the tests that BIRD did poorly on realistic? Unlikely. It’s finding an edge case in which BIRD performs badly, but you are unlikely to get to that place.
BIRD as a tester takes less resources, so I’ve made it the default tester now. But Exa had a problem with RustyBGP, so it might be good to use it as one more compatibility test.
I’m not yet sure what we learned about hold timers. Ideally 5 second hold timers for containers that are on the same computer shouldn’t be a problem; maybe I’m being naïve?
bgperf is a bit better every time.
RustyBGP
Did RustyBGP get better? Yes, much better. It’s the fastest in the MRT bgpdump2 playback tests. It’s not as fast as FRR in the many neighbors tests, but those are less realistic. We finally have a BGP stack that can take advantage of modern hardware. (I mean, that I’m measuring. I know there are others that probably do also, but they are commercial and I just haven’t gotten there yet.) However, it also has some weird problem with Exa as the tester that I have not tracked down.
I think it has a problem with hold timers. At least I can get a lot of hold timers to expire and I think that’s bad, but am not sure.
BIRD
BIRD is much slower than expected when there are many neighbors (> 500) neighbors. At least it gets much worse than expected.
I’m also concerned about the results from 50 neighbors with bgpdump2. As noted, the bgperf now checks to see if the total received prefixes at the monitor goes down and fails if it has for 10 seconds. BIRD does that and I don’t know what it means. No other stack does this.
OpenBGPD
As noticed before it has some reset on bgpdump2 that I have tracked down. By default it has on enforce neighbor-as, which does a check no other BGP stack does by default.
It also uses more memory, and a lot more memory per neighbor. It’s been commented to previous posts that is because it has a separate ADJ-RIB-IN for every neighbor rather than a shared one with pointers. I think the implication is that it might be for safety. Whatever the reason, if you have lots of neighbors it will cost you. Possibly it doesn’t matter, but it might.
Which stack to use
I still don’t know. If any of my previous conclusions made you think you should pick one over the other, I’m sorry. I’m just trying to measure and find differences. This post especially is just targeted to specific tests. If you have more than 500 neighbors with BIRD and they each have lots of routes then maybe you should be worried.
FRRouting is a strong performer in all of these tests. It’s interesting that for IXP style work BIRD and OpenBGPD seem to be the the two choices for everyone. I don’t know if that is because several years ago Quagga/FRRouting was poor in performance here, that at least seems to have been the story.
Of course, there are still big pieces of BGP stack performance, especially routing policy and filtering, that I’ve not gotten to and are extremely important.
I wouldn’t use GoBGP if performance is an issue. RustyBGP is still immature but promising.